On-chain data shows the Bitcoin ‘Apparent Demand’ indicator has flipped back to positive. Here’s what this could mean for the asset’s price.
Bitcoin Apparent Demand Has Surged Back Into Positive Territory
In a new post on X, Ki Young Ju, the founder and CEO of the on-chain analytics firm CryptoQuant, discussed the latest trend in the Apparent Demand indicator for Bitcoin.
“Apparent demand is the difference between production and changes in inventory,” notes Young Ju. “For Bitcoin, production refers to mining issuance, while inventory refers to inactive supply for over a year.”
The mining issuance here measures the total amount of BTC that the miners produce by adding blocks to the network and receiving rewards. At the same time, the one-year inactive supply comprises the tokens that haven’t been transferred on the blockchain for more than one year.
Below is the chart for the Apparent Demand for Bitcoin shared by the analyst.
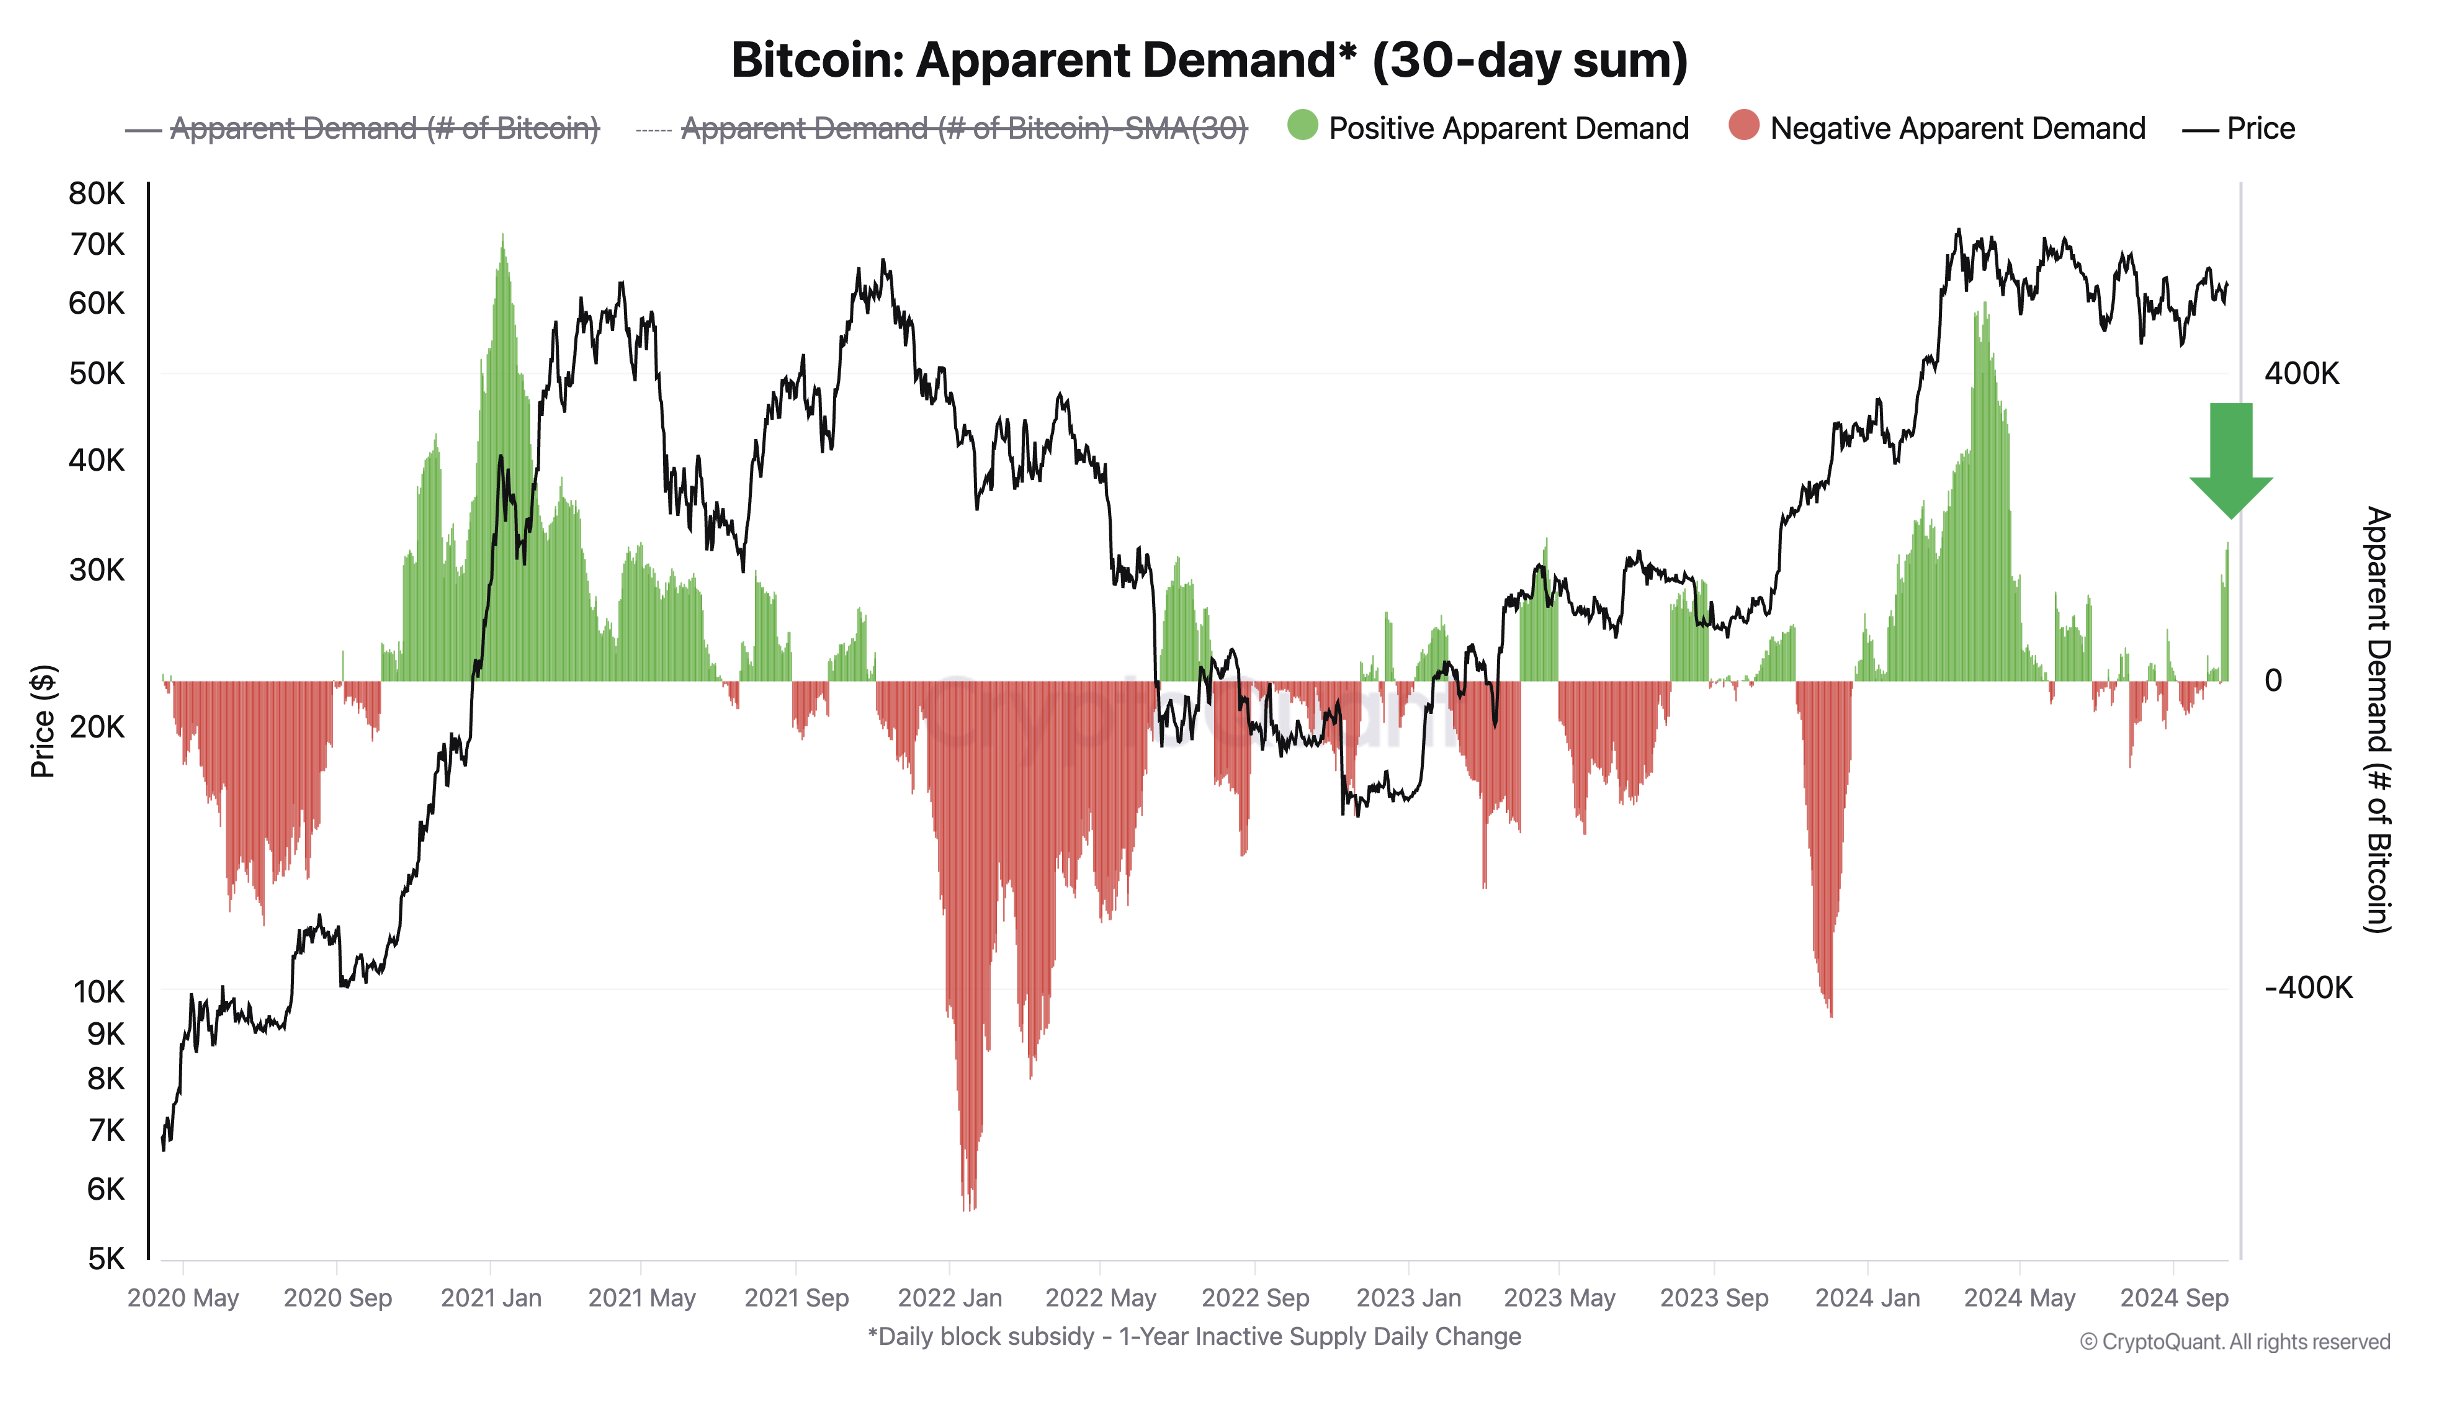
As is visible in the graph, the Bitcoin Apparent Demand had risen to highly positive levels during the rally to the new all-time high (ATH) in the year’s first quarter.
A positive value suggests the decrease in the BTC inventory is greater than its production. “If the decrease in inventory exceeds production, demand is increasing, and vice versa,” explains the CryptoQuant CEO.
However, the high demand for the cryptocurrency couldn’t be maintained as the metric had slumped to neutral values soon after the asset’s price had fallen into its consolidation phase.
However, this trend of sideways movement around nearly neutral levels appears to have finally been broken recently, as the metric has witnessed a positive spike.
So far, the Apparent Demand hasn’t reached levels anywhere near as high as back during the March ATH, but its current value is still quite notable, indicating that demand has returned for the coin.
Another metric that signals that fresh demand is coming into Bitcoin is the Realized Cap of the new investors, as CryptoQuant author Axel Adler Jr. pointed out in a new post on X.
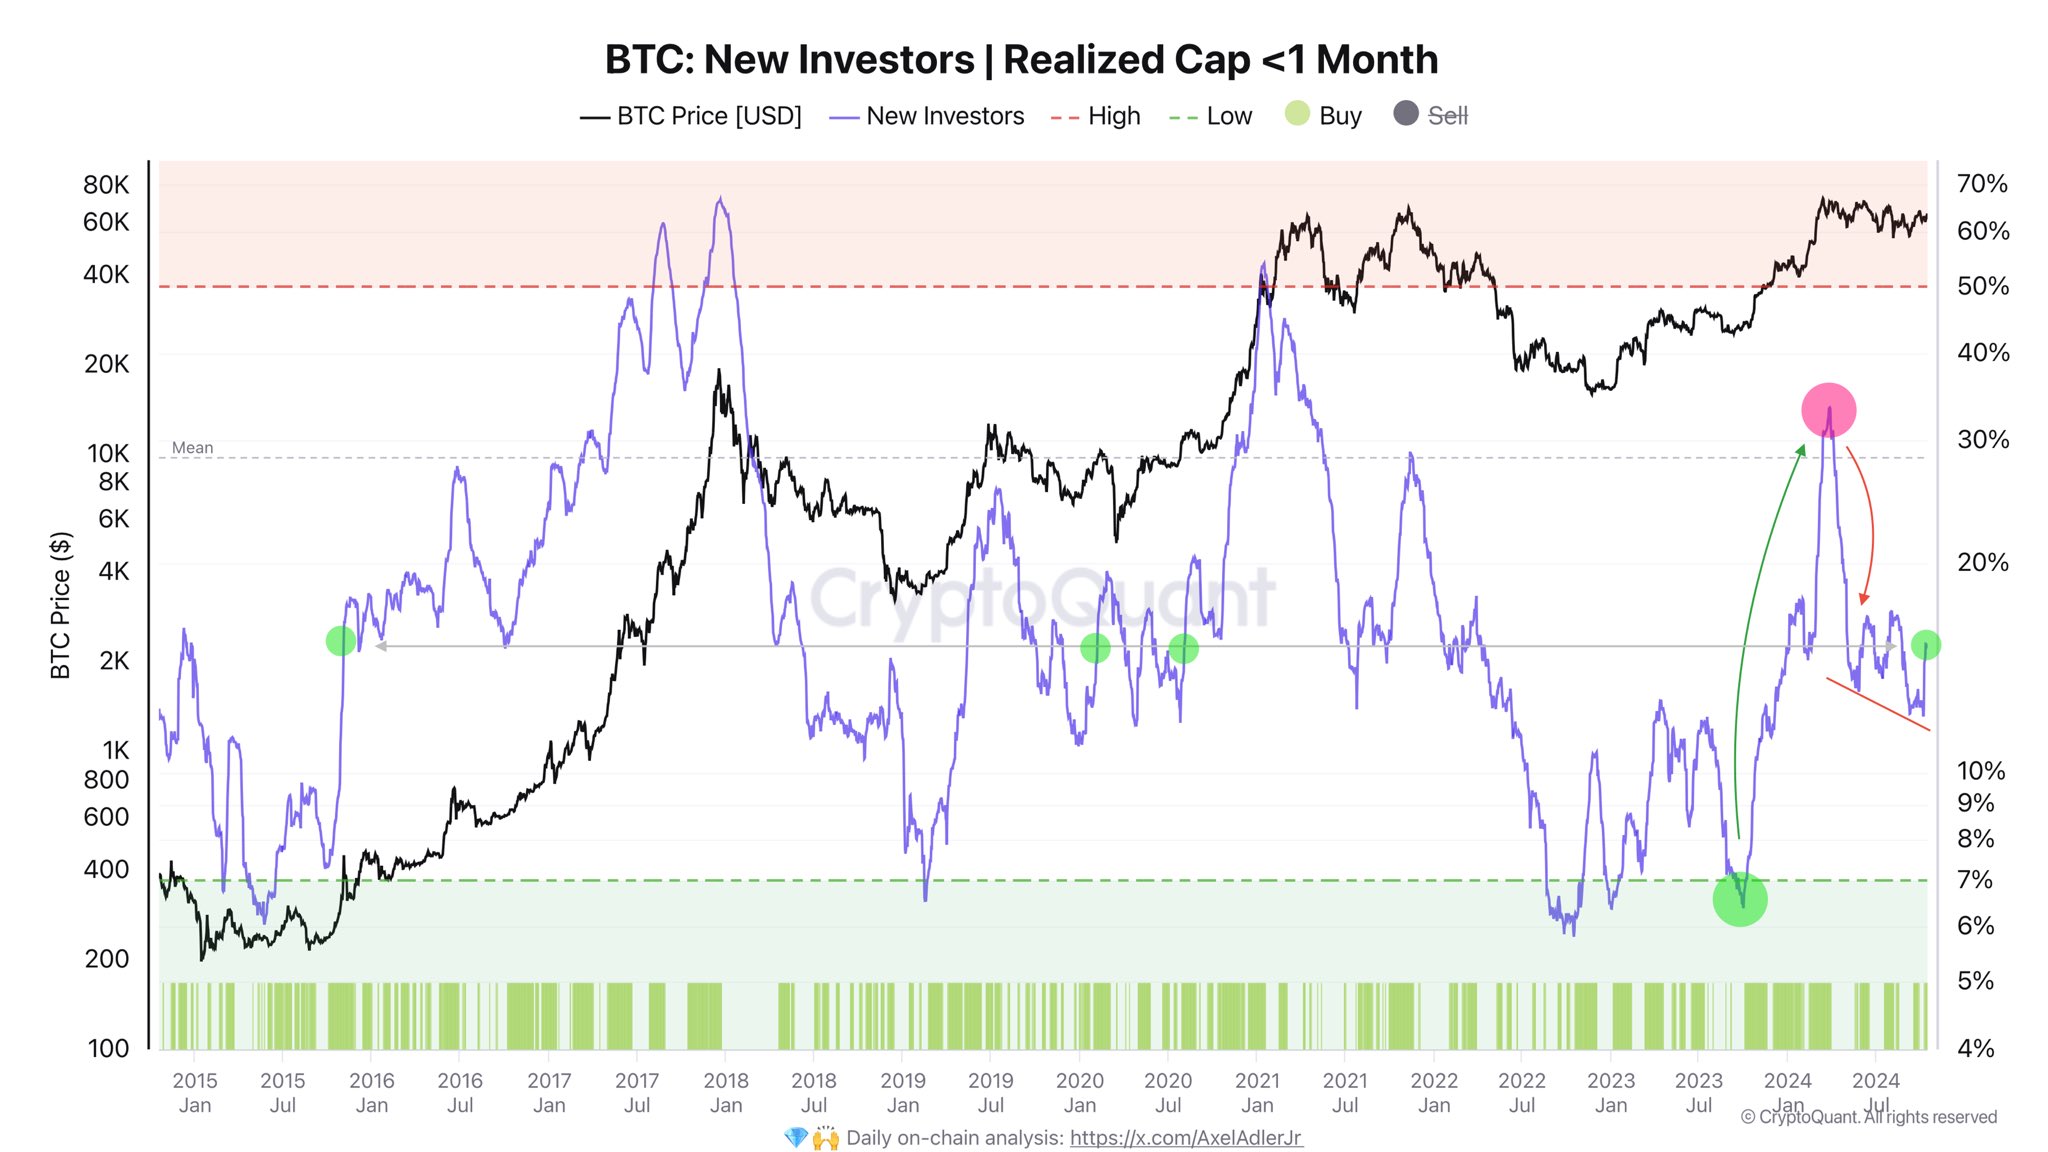
The Realized Cap is an indicator that, in short, keeps track of the total amount of capital that the Bitcoin investors as a whole have invested into the cryptocurrency.
In the chart, the data for the Realized Cap, specifically for the “new investors”, is shown, which are the holders who purchased their coins within the past month. This metric can proxy for the new capital coming into the asset.
“Demand for coin purchases from new investors has resumed, with a 3% increase over the last 10 days. This is a positive signal for the market,” notes the analyst.
BTC Price
Bitcoin had neared the $68,000 level earlier in the day, but it appears to have seen a pullback, as it’s now back at $66,100.

You can get bonuses upto $100 FREE BONUS when you:
💰 Install these recommended apps:
💲 SocialGood - 100% Crypto Back on Everyday Shopping
💲 xPortal - The DeFi For The Next Billion
💲 CryptoTab Browser - Lightweight, fast, and ready to mine!
💰 Register on these recommended exchanges:
🟡 Binance🟡 Bitfinex🟡 Bitmart🟡 Bittrex🟡 Bitget
🟡 CoinEx🟡 Crypto.com🟡 Gate.io🟡 Huobi🟡 Kucoin.


Comments