An analyst has explained how the data of an on-chain indicator could suggest a bullish trend is still on for Bitcoin despite the latest pullback.
Bitcoin Coinbase Flow Pulse Is Still Signaling Bull Market
In a new post on X, CryptoQuant author Axel Adler Jr has talked about the latest trend in the Bitcoin Coinbase Flow Pulse. The “Coinbase Flow Pulse” refers to an indicator that keeps track of the total amount of BTC flowing into Coinbase from other centralized exchanges.
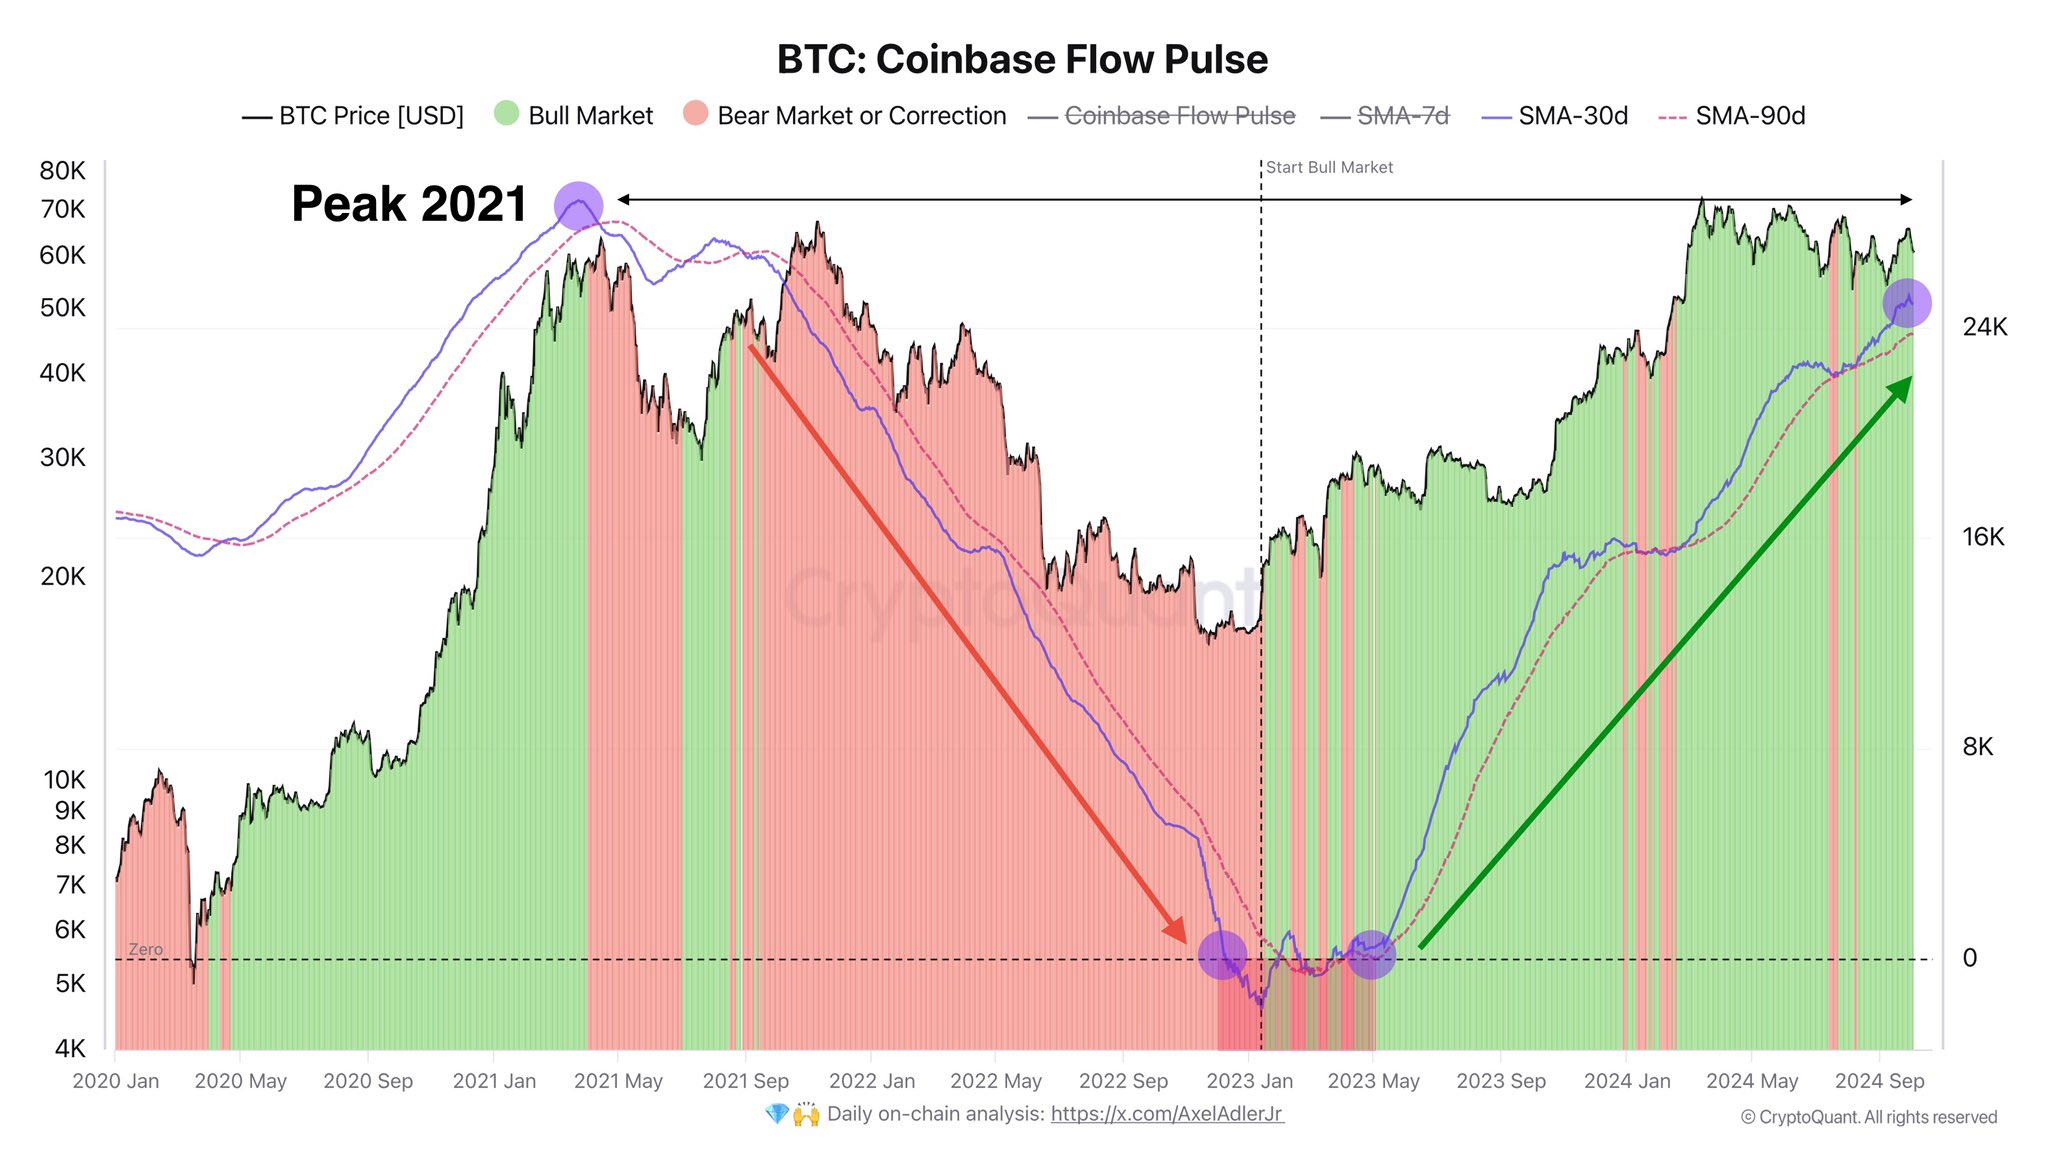
Here is the chart shared by the analyst, which shows the trend in the 30-day and 90-day simple moving averages (SMAs) of this indicator over the last few years:
As displayed in the above graph, the Bitcoin Coinbase Flow Pulse has seen both of these SMAs moving up since early 2023, suggesting that there has been a long-term trend of increasing inflows to Coinbase from other platforms.
At present, the 30-day is still above the 90-day, which means the inflows are continuing to accelerate. From the perspective of this indicator, whenever these two lines are arranged in this manner, Bitcoin can be assumed to be in a bull market.
The periods where this condition held true are highlighted in green on the chart. It would appear that the metric has only seen a bearish crossover a few times since this uptrend began, with each ‘bear’ period lasting just momentarily.
In recent days, the Bitcoin price has observed some notable bearish momentum, but so far, this indicator has shown no signs of a bearish cross. “Despite the local pullback, the bullish trend persists,” notes the analyst.
As for why a transfer from other exchanges to Coinbase is considered bullish, the reason lies in the type of users that do their trading activities on the platform. Coinbase is primarily used by US-based investors, especially the large institutional entities, who tend to be the drivers of the market.
Inflows to Coinbase imply demand from such users is up, which can end up reflecting into the cryptocurrency’s value. The Coinbase Flow Pulse isn’t the only indicator that’s used for gauging demand from the American investors, there is also the Coinbase Premium Gap, which tells us about the short-term changes in demand.
This indicator measures the difference between the Bitcoin prices listed on Coinbase (USD pair) and Binance (USDT pair). Binance is used by a global traffic, so this metric’s value basically represents the difference in behavior between US and world users.
Below is a chart for the 1-hour version of this indicator shared by an analyst in a CryptoQuant Quicktake post.

As the quant has highlighted in the graph, the 1-hour Bitcoin Coinbase Premium Gap has shown a break above the daily recently, which can be a sign that buying from Coinbase users is starting to pick up.
BTC Price
Bitcoin has taken to sideways movement since its plunge to start the month as its price is still trading around $61,300.

You can get bonuses upto $100 FREE BONUS when you:
💰 Install these recommended apps:
💲 SocialGood - 100% Crypto Back on Everyday Shopping
💲 xPortal - The DeFi For The Next Billion
💲 CryptoTab Browser - Lightweight, fast, and ready to mine!
💰 Register on these recommended exchanges:
🟡 Binance🟡 Bitfinex🟡 Bitmart🟡 Bittrex🟡 Bitget
🟡 CoinEx🟡 Crypto.com🟡 Gate.io🟡 Huobi🟡 Kucoin.









Comments