On-chain data shows recent trend in the Bitcoin transaction fees indicator may suggest that the crypto is now entering the late bear market stages.
Bitcoin “Fees To Block Reward” Metric Has Gone Up Recently
As pointed out by an analyst in a CryptoQuant post, the BTC fees metric may show that the bear market could be advancing to late stage now.
The relevant indicator here is the “fees to block reward,” which measures what percentage of the total block reward is made up by the Bitcoin transaction fees.
When the value of this metric goes up, it means the fee is making up a higher amount of the total miner reward now.
This could suggest that activity is going up in the network. Such a trend typically occurs during bull market periods.
On the other hand, a downtrend of this indicator may imply that the blockchain is turning more inactive right now. Low values of the metric usually appear during bear markets.
Now, here is a chart that shows the trend in the Bitcoin fees to block reward (30-day MA) over the last few years:
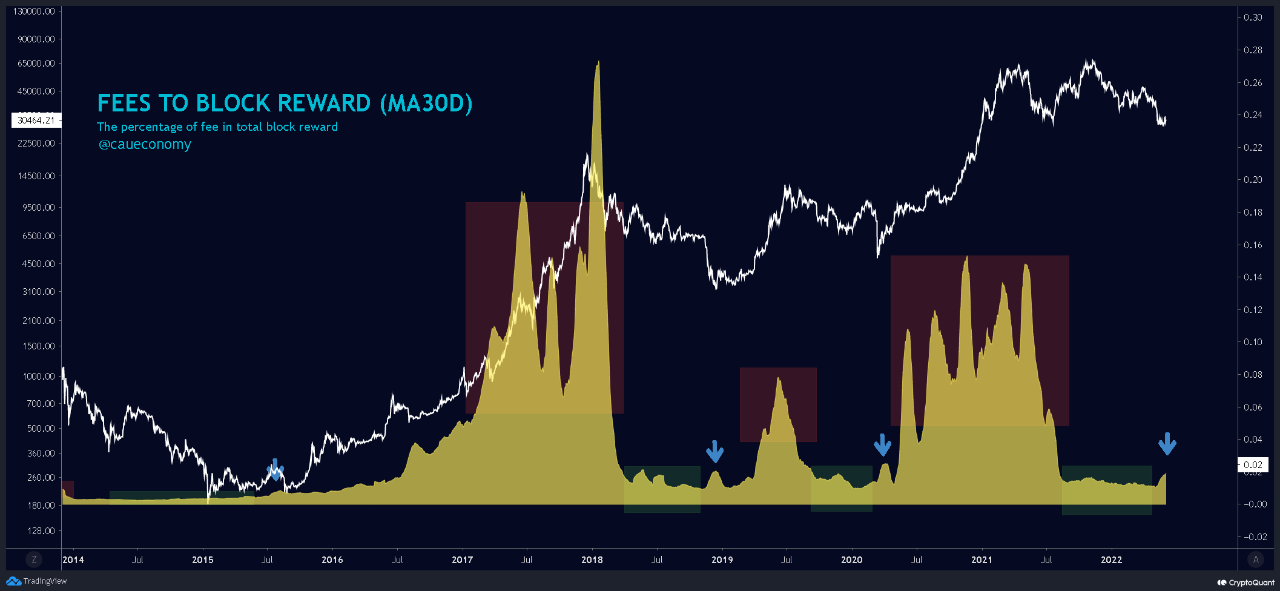
Looks like the value of the indicator has been going up recently | Source: CryptoQuant
In the above graph, the quant has marked the important regions of trend of the Bitcoin fees to block reward metric.
It seems like in the lead up to and during the bull runs, the value of the fees indicator has historically been very high.
Related Reading | Chipotle Now Accepts Payments In Bitcoin, Dogecoin
On the contrary, the metric has always assumed quite low values during bear market periods. Both these trends are consistent with what is expected.
Over the last few months, the metric flatlined at a low value as the fees remained low due to a lack of activity on the chain.
However, just recently the transaction fees has shot up in value, producing a spike in the fees to block reward indicator.
Related Reading | Bitcoin ATM Installations Notch Record Drop In May – Demand For Crypto Waning?
Such spikes have appeared during bear markets in the past as well, and they have generally signaled the start of a late-stage bear market.
If these previous instances are anything to go by, then the current spike in the metric may also suggest Bitcoin is now entering a late bear period.
BTC Price
At the time of writing, Bitcoin’s price floats around $31.6k, up 3% in the past seven days. The below chart shows the trend in the price of the crypto over the last five days.

The price of the coin seems to have surged up over the past day | Source: BTCUSD on TradingView
Featured image from Unsplash.com, charts from TradingView.com, CryptoQuant.com

You can get bonuses upto $100 FREE BONUS when you:
💰 Install these recommended apps:
💲 SocialGood - 100% Crypto Back on Everyday Shopping
💲 xPortal - The DeFi For The Next Billion
💲 CryptoTab Browser - Lightweight, fast, and ready to mine!
💰 Register on these recommended exchanges:
🟡 Binance🟡 Bitfinex🟡 Bitmart🟡 Bittrex🟡 Bitget
🟡 CoinEx🟡 Crypto.com🟡 Gate.io🟡 Huobi🟡 Kucoin.












Comments