On-chain data shows that spending from Bitcoin long-term holders has spiked recently. Here’s how the current levels compare with the 2021 bull run.
Bitcoin 1+ Years Coins Have Been On The Move Recently
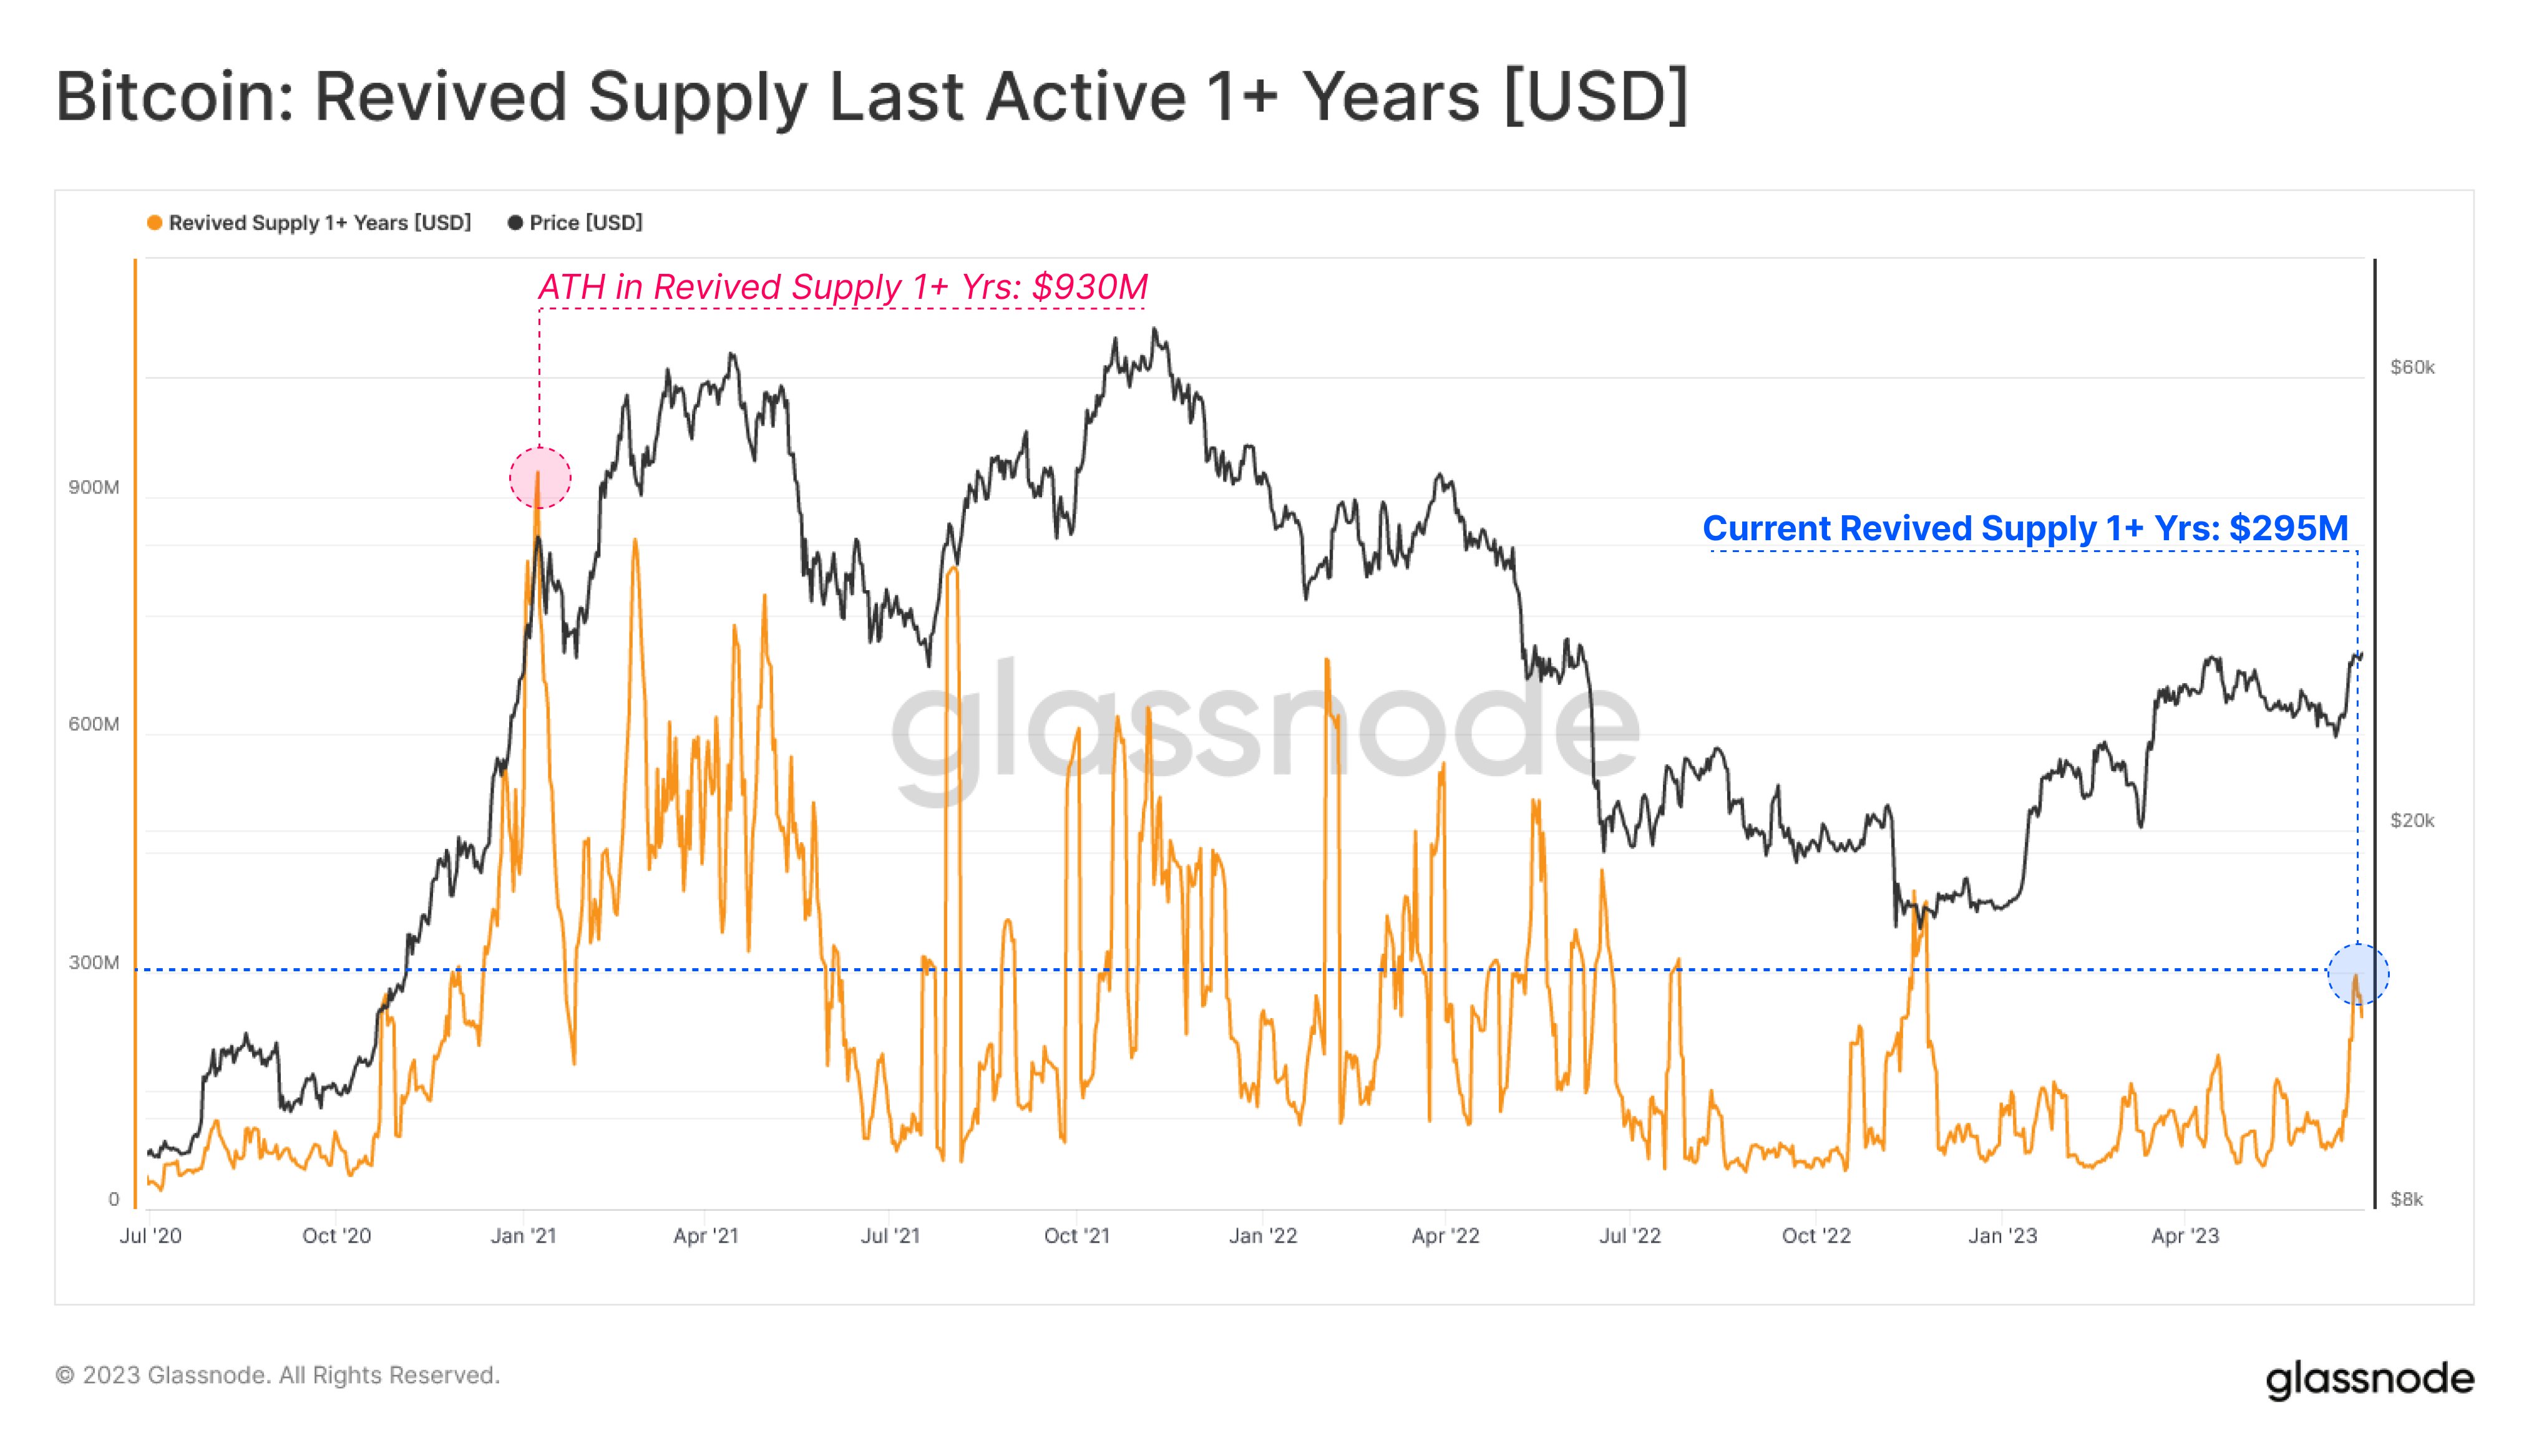
According to data from the on-chain analytics firm Glassnode, old hands have spent $295 million worth of the asset in recent days. The relevant indicator here is the “revived supply last active 1+ years,” which measures the total amount of tokens (in USD) that Bitcoin investors holding since at least one year ago are transferring/moving on the blockchain right now.
The 1+ years group forms a segment of a larger cohort: the “long-term holders” (LTHs). The LTHs include all investors who bought their coins more than 155 days ago. Therefore, the 1+ years group includes the more experienced investors even among the LTHs.
Generally, the longer an investor holds onto their coins, the less likely they become to sell them at any point. As such, the LTHs usually hold for long periods (hence their name) and don’t sell easily even when the market is going through a panic.
Assuming that the movements being made by these investors are for selling (which is usually the case when dormant coins move), the revived supply last active 1+ years indicator tells us about the times that these experienced hands do end up participating in some selling.
Now, here is a chart that shows the trend in this Bitcoin indicator over the last few years:
As displayed in the above graph, the Bitcoin revived supply last active 1+ years has observed a spike recently. This would suggest that the LTHs have moved some of their coins.
This rise in the indicator has come as the cryptocurrency’s price has displayed a sharp rally beyond the $30,000 level. Due to this timing, it would appear likely that these transactions have been made for selling-related purposes, as these experienced hands may be looking to take advantage of the profit-taking opportunity.
As mentioned before, these investors don’t sell too often, so moments like these can be the ones to watch for when they do distribute. From the chart, however, it’s visible that while the latest spike in the metric has been sizeable (at its peak, the indicator’s value had reached $295 million), its level is still significantly lower than the surges observed throughout 2021 bull market.
A lot of the spikes during that bull run had coincided with local tops, but since the scale of the current spike is still lower, it’s possible that the rally may not yet feel the effect of this selling.
In fact, the level of the current spike is similar to the ones seen during the build-up to the bull run, which the market had breezed past as the Bitcoin price had continued to go up back then.
BTC Price
At the time of writing, Bitcoin is trading around $30,600, up 2% in the last week.

You can get bonuses upto $100 FREE BONUS when you:
💰 Install these recommended apps:
💲 SocialGood - 100% Crypto Back on Everyday Shopping
💲 xPortal - The DeFi For The Next Billion
💲 CryptoTab Browser - Lightweight, fast, and ready to mine!
💰 Register on these recommended exchanges:
🟡 Binance🟡 Bitfinex🟡 Bitmart🟡 Bittrex🟡 Bitget
🟡 CoinEx🟡 Crypto.com🟡 Gate.io🟡 Huobi🟡 Kucoin.


Comments