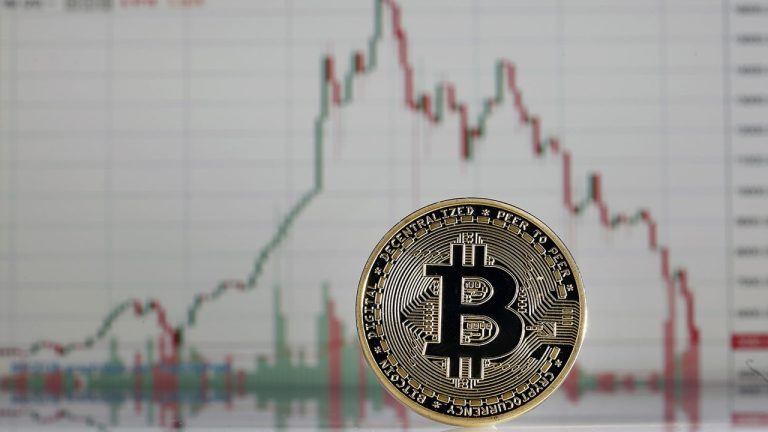
It may be unlikely, but Bitcoin has a lot more room to lure bears into a false sense of security, one analyst forecasts.
Bitcoin (BTC) can return to $50,000 and still not violate an overall “bullish thesis” after breaking all-time highs, fresh research argues.
In its latest market update on Oct. 22, crypto trading platform Decentrader argued that after hitting and retracing from $67,000, there was no reason to be bearish on Bitcoin.
“No significant evidence” for $50,000 retest
After Bitcoin cracked an all-time high in place for six months, concerns grew as a correction took place that erased 10% of its gains in a single day.
After two dips below $60,000, analysts nonetheless have stuck to their previous optimism for the coming weeks and months. Decentrader’s Filbfilb is no exception.
“We have been tracking a Bitcoin fractal pattern for a number of weeks now, which, if it continues, would imply to play out, that the next major stop higher for Bitcoin would be $72k if momentum can be maintained, after which the 1.618 extensions suggests around $88k would prove to be a target of interest, which ties in with the idea that $100k will see some front running by sellers,” he summarized.
He pointed to cooling funding rates, increased exposure from Bitcoin futures exchange-traded funds and strong buyer support as all being conducive to further upside.
The weekend, which typically sees thinner markets, could produce a surprise move up or down, however, with an uptick likely meeting resistance at $65,000 — the old high.
Filbfilb also revealed that he was primed for a potential deeper BTC price dip — one which would still need to try extremely hard to break his bullish conviction.
“If there is a significant reversal and break in structure, $50k will be a significant area of interest to us,” he added.
“Although there is no significant evidence of this now, we are prepared for an opportunity, should it present itself. Even if prices do retrace to these levels, it does not break our overall bullish thesis.”

The math strengthens bulls’ resolve
As with other recent findings, Fibonacci levels continue to play a key role in assessing likely future price points in an up-or-down market phase.
Related: Need some Bitcoin ‘hopium?’ This chart calls for new BTC price all-time high by November
Bitcoin has historically had its macrocycle peaks rooted in Fib sequences, which opens the door to hit $300,000 this time around.
Similarly, the next bear market from such highs should bottom out at around current levels, with the worst-case scenario at just below $50,000.


You can get bonuses upto $100 FREE BONUS when you:
💰 Install these recommended apps:
💲 SocialGood - 100% Crypto Back on Everyday Shopping
💲 xPortal - The DeFi For The Next Billion
💲 CryptoTab Browser - Lightweight, fast, and ready to mine!
💰 Register on these recommended exchanges:
🟡 Binance🟡 Bitfinex🟡 Bitmart🟡 Bittrex🟡 Bitget
🟡 CoinEx🟡 Crypto.com🟡 Gate.io🟡 Huobi🟡 Kucoin.


Comments