On-chain data shows the Bitcoin taker buy-sell ratio has rebounded back into the “hold” zone after touching the selling level.
Bitcoin Taker Buy-Sell Ratio Observes Brief Uplift Recently
As explained by an analyst in a CryptoQuant post, taker buy-sell ratio may have a hint about where BTC can head next.
The “taker buy-sell ratio” is an indicator that measures the ratio between the Bitcoin buy volume and the sell volume.
When the value of this metric is above one, it means the long volume is more than the sell volume at the moment. Such a trend suggests the sentiment is bullish in the market right now.
On the other hand, ratio values below one indicate that the general sentiment among the investors may be bearish right now.
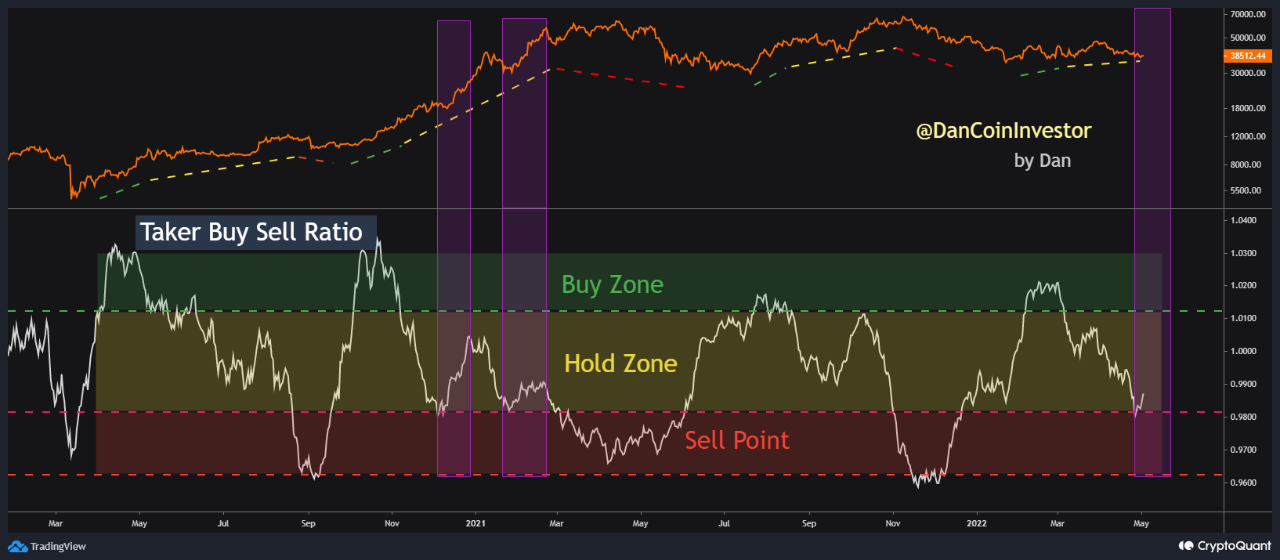
Now, here is a chart that shows the trend in the Bitcoin taker buy-sell volume over the last couple of years:

The value of the indicator seems to have observed a small surge recently | Source: CryptoQuant
As you can see in the above graph, the quant has divided the Bitcoin taker buy-sell ratio into three different zones.
The analyst believes it’s best to buy BTC when the indicator is in the green zone, and to sell during periods of the red region.
Related Reading | Bitcoin Holders Trigger Largest Capitulation In Its History, Bearish Horizon For BTC?
The yellow portion between these two is the “hold zone,” where holding until the metric touches the upper red level can be the ideal course of action.
Recently, the indicator plunged down and tested this upper sell level. However, since then the metric has rebounded back up a bit instead of diving inside the red zone further.
Such a formation has been observed a few times in the last two years, and the analyst has highlighted these with a purple box.
Related Reading | Bitcoin Price Continues Struggle, But Miners Refuse To Sell
It seems like the last couple of times this trend occurred, the price of Bitcoin observed some uptrend shortly after.
So if this pattern repeats this time as well, the quant believes the crypto is likely to see another rebound this month or the next.
However, something worth noting is that one more instance of this Bitcoin taker-buy sell ratio formation took place in early 2020, but back then the price instead followed up with a crash.
BTC Price
At the time of writing, Bitcoin’s price floats around $38.3k, down 4% in the last week. The below chart shows the trend in the price of the crypto over the past five days.

It looks like the price of BTC has mostly moved sideways over the last few days | Source: BTCUSD on TradingView
Featured image from Unsplash.com, charts from TradingView.com, CryptoQuant.com
Tags: bitcoinBitcoin Taker Buy/Sell Ratiobtcbtcusd

You can get bonuses upto $100 FREE BONUS when you:
💰 Install these recommended apps:
💲 SocialGood - 100% Crypto Back on Everyday Shopping
💲 xPortal - The DeFi For The Next Billion
💲 CryptoTab Browser - Lightweight, fast, and ready to mine!
💰 Register on these recommended exchanges:
🟡 Binance🟡 Bitfinex🟡 Bitmart🟡 Bittrex🟡 Bitget
🟡 CoinEx🟡 Crypto.com🟡 Gate.io🟡 Huobi🟡 Kucoin.


Comments