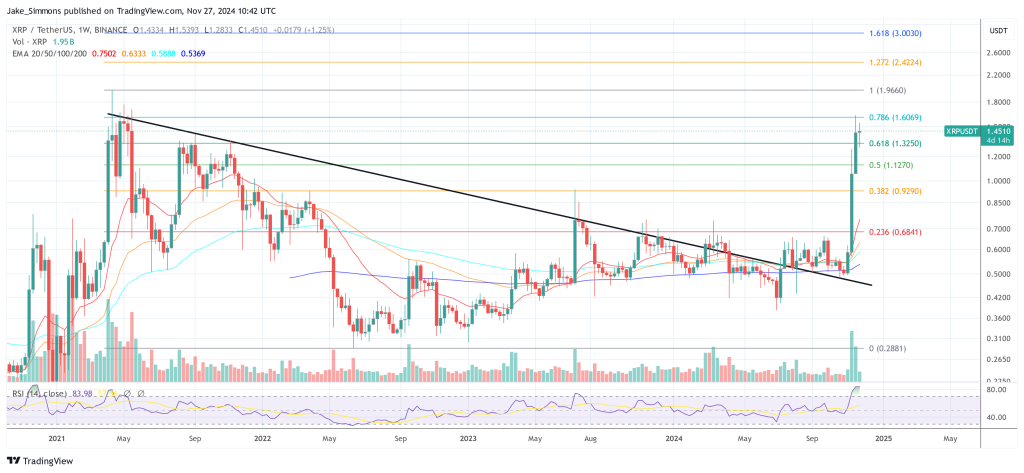
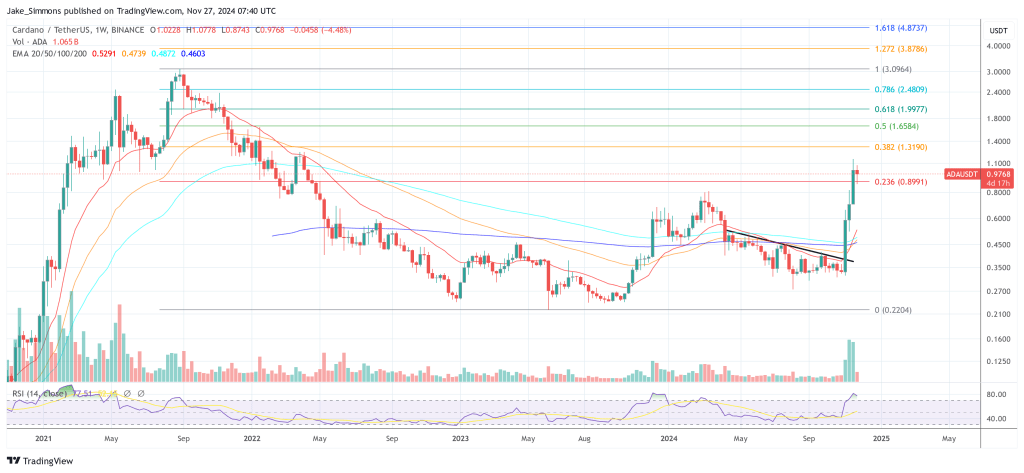
Moving Averages (MA)
The Moving average (MA) is one of the most straightforward tools used in Technical Analysis (TA). The moving average is the average price over a time period, we often use the 200 days moving average, 50 days moving average, and the 20 days moving average. It can be used for any timeframe.
MAs with a shorter timeframe react much faster to price changes. There are also different kinds of Moving Averages used, for example, the SMA (simple moving average) or the EMA (exponential moving average). They differentiate in they behave a little bit. Since this is an introduction, I will not go into further detail here.
The 200-Day (simple) Moving Average (SMA)
The 200 SMA represents the average price over the past 200 days. It is mainly used to spot up- and downtrends and also identify support and resistance areas.
Bulb: At the Support level of a Crypto asset, the downtrend should stop or pause for a while. This happens because there is expected that there is a high concentration of buying interest of Crypto Investors.
As a rule of thumb, if the price is above the 200 MA, the trend is up; if it's below, the trend is down.
The 50-Day Simple Moving Average (SMA)
This moving average is also very popular under technical traders. It is considered the first line of support in uptrend markets and the first line of resistance if the markets are going down.
You may have stumbled across two important terms above: the Death Cross and the Golden Cross. In both turns of trend events, the 200 SMA and the 50 SMA are involved.
A so-called Death Cross happens if 50 SMA is crossing the 200 SMA from up to down. This is often seen that a bear market is coming up. On the other hand, the Golden Cross is when the 50 SMA crosses the 200 SMA from down to up, good times are supposed to happen.
The 20-Day Simple Moving Average (SMA)
The shorter the timeframe, the faster the Moving Averages are reacting to the price changes in the market. With a shorter period, like the average price of 20 days, you can spot changes in trends faster, but it is also more likely that you get a false alarm because of a bit of breakout.
Moving averages are popular within Crypto Traders and often used with other key indicators for both, exits and entries. Do not forget you can not predict the future from the past, but you can draw some lines in the sand, get some grip, and better understand price developments.
Next will have a look at the relative strength index indicator, which is a momentum indicator.
Relative Strength Index (RSI)
The RSI indicates if a digital asset is overbought or oversold. The Relative Strength Index indicates bullish or bearish price momentum; usually, if the RSI is about 70 %, that means a cryptocurrency is overbought. If the Index is under 30 %, it is oversold. The RSI measures the magnitude of a recent change in the price within a period of time (usually 14 days, 14 hours, etc.). The data are shown on an oscillator between 0 and 100.
Generally speaking, when the RSI goes below the 70 % level, this can be seen as a bearish signal; on the other hand, if it climbs above 30 %, this can be seen as a bullish sign. A momentum indicator like the RSI can give an idea if buyers have the market under control or sellers might take over.
Like all other indicators and financial metrics, the signals can be misleading, so it is best not to use them as a direct sell and buy signals.
Moving Average Convergence Divergence (MACD)
The MACD is a trend-following momentum indicator. It subtracts the 26-period EMA from the 12-period EMA and measures the relationship between two EMA's.
The Moving Average Convergence Divergence is made up of two lines. There is the MACD line and the signal line. Most charting tools (e.g., Tradingview ) also show a histogram showing the distance between the signal and the MACD line.
Traders can get an insight into the strength of the current trend by looking at the MACD chart.
For example, if the price chart shows higher highs, but the MACD shows lower highs, there is a higher probability that the markets could start going down soon. The price is increasing while the momentum is decreasing.
Momentum is the speed or velocity of an Asset's price change
Both MACD and RSI are used together since both, measure the momentum, but by different factors.
Bollinger Bands (BB)
Bollinger Bands measure the volatility of the markets and also if the market is overbought and oversold.
BBs consist of three lines:
the middle Band - simple moving average. The standard is usually the 20 SMA
the upper Band (usually two standard deviations from the middle Band)
the lower Band (usually two standard deviations from the middle Band)
A standard deviation is a statistic that measures the dispersion of a dataset relative to its mean.
With the increase in volatility, the distance between bands increases. Smaller volatility is shown with a smaller distance. The closer the price is to the upper Band in general, the more overbought the price; the closer to the lower Band, we are in an oversold market. A breakout of the Band shows extreme market conditions
[link] [comments]

You can get bonuses upto $100 FREE BONUS when you:
💰 Install these recommended apps:
💲 SocialGood - 100% Crypto Back on Everyday Shopping
💲 xPortal - The DeFi For The Next Billion
💲 CryptoTab Browser - Lightweight, fast, and ready to mine!
💰 Register on these recommended exchanges:
🟡 Binance🟡 Bitfinex🟡 Bitmart🟡 Bittrex🟡 Bitget
🟡 CoinEx🟡 Crypto.com🟡 Gate.io🟡 Huobi🟡 Kucoin.


Comments