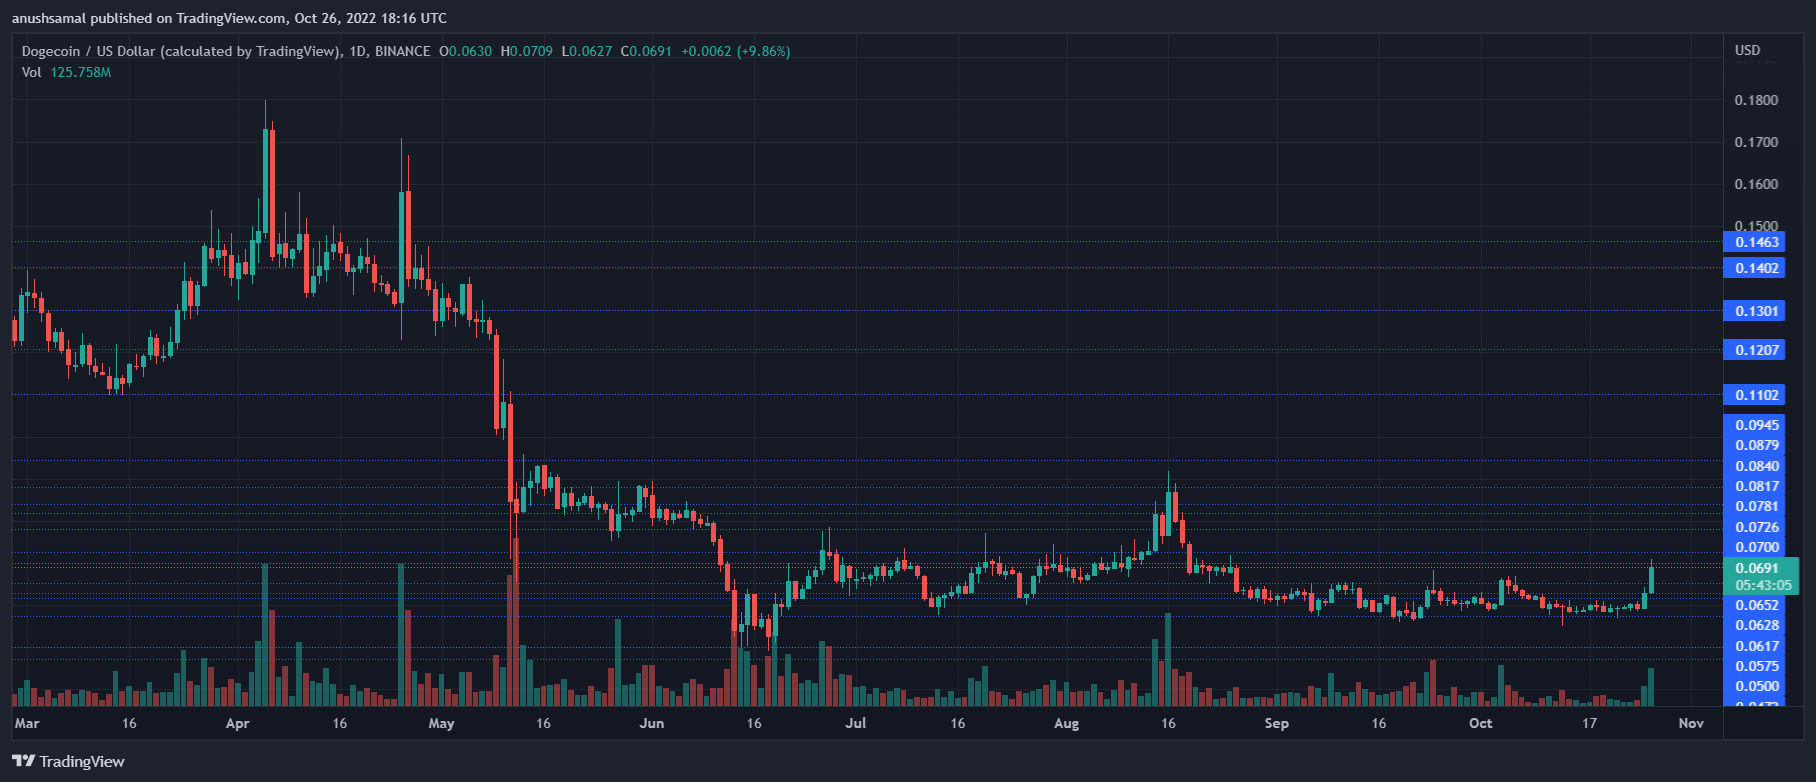
Dogecoin price has risen substantially over the past day. In that timeframe, the coin’s value had appreciated by double digits.
Over the last week, Dogecoin price logged a 12% gain, proving that the coin has rallied recently.
The coin has been one of the top gainers on the chart, along with Ethereum, as both coins secured double-digit gains.
The meme-coin has secured a monthly high at this price level. Dogecoin price finally broke through their consolidation and passed through their resistance, converting it into a support line.
The technical outlook for the coin has turned bullish for the Dogecoin price. The buyers came back into the market as demand for the crypto considerably increased.
If Dogecoin continues its price momentum, then the coin can move past the $0.70 price mark and touch $0.80, which would help the bulls to push past further price levels.
At the current price level, the Dogecoin price is still trading at a 90% low from its all-time high, which it secured in the month of May 2021.
Dogecoin Price Analysis: One-Day Chart

DOGE was trading at $0.069 at the time of writing. The coin broke past the $0.063 price mark, which is now acting as local support for the coin.
Over the next trading sessions, the coin could push past the $0.070 mark. The immediate resistance mark for the Dogecoin price will be at $0.72 and then at $0.78 before it attempts to trade at $0.80.
Touching the $0.80 mark will prove to be a multi-month high for the coin. On the other hand, a slip from the current price level will take Dogecoin straight to $0.56 and then to $0.50.
The amount of Dogecoin traded in the last session soared substantially, signaling an increased demand for the coin.
Technical Analysis

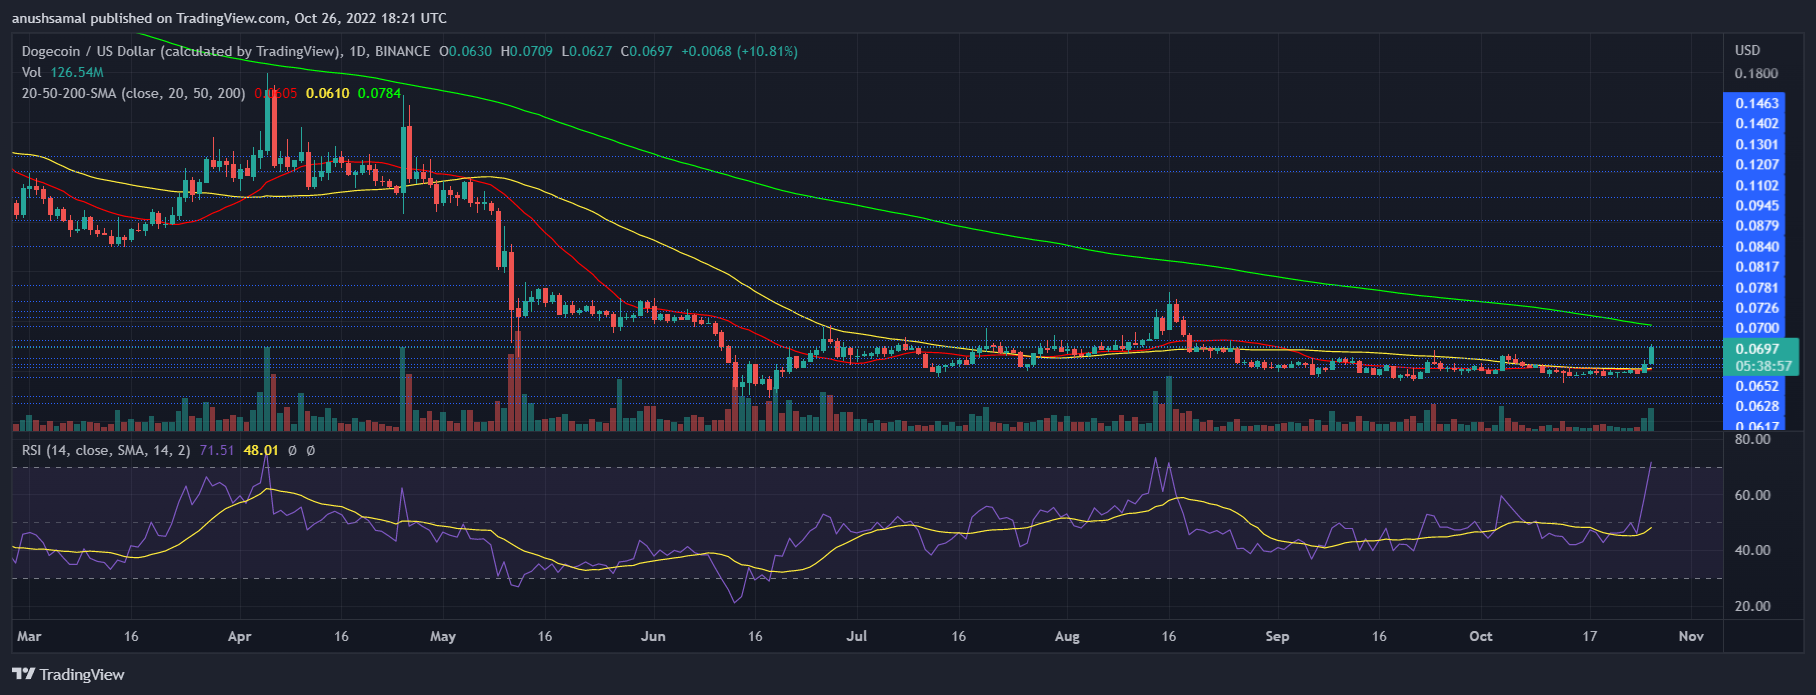
The altcoin displayed overvalued conditions at the time of writing. The last time Dogecoin entered the overbought zone was in the month of August.
The Relative Strength Index displayed a perpendicular recovery as the indicator moved above the half-line and went straight to the 80-mark.
This meant that buyers heavily outnumbered sellers. The Dogecoin price soared past the 20-SMA, which again indicated that there was a rapid growth in demand for the meme-coin and that buyers were driving the price momentum in the market.
A continued push from the bulls can also form a golden cross, which means that the 20-SMA line will cross above the 50-SMA line. This reading signifies a heavy bullish influence on the asset.

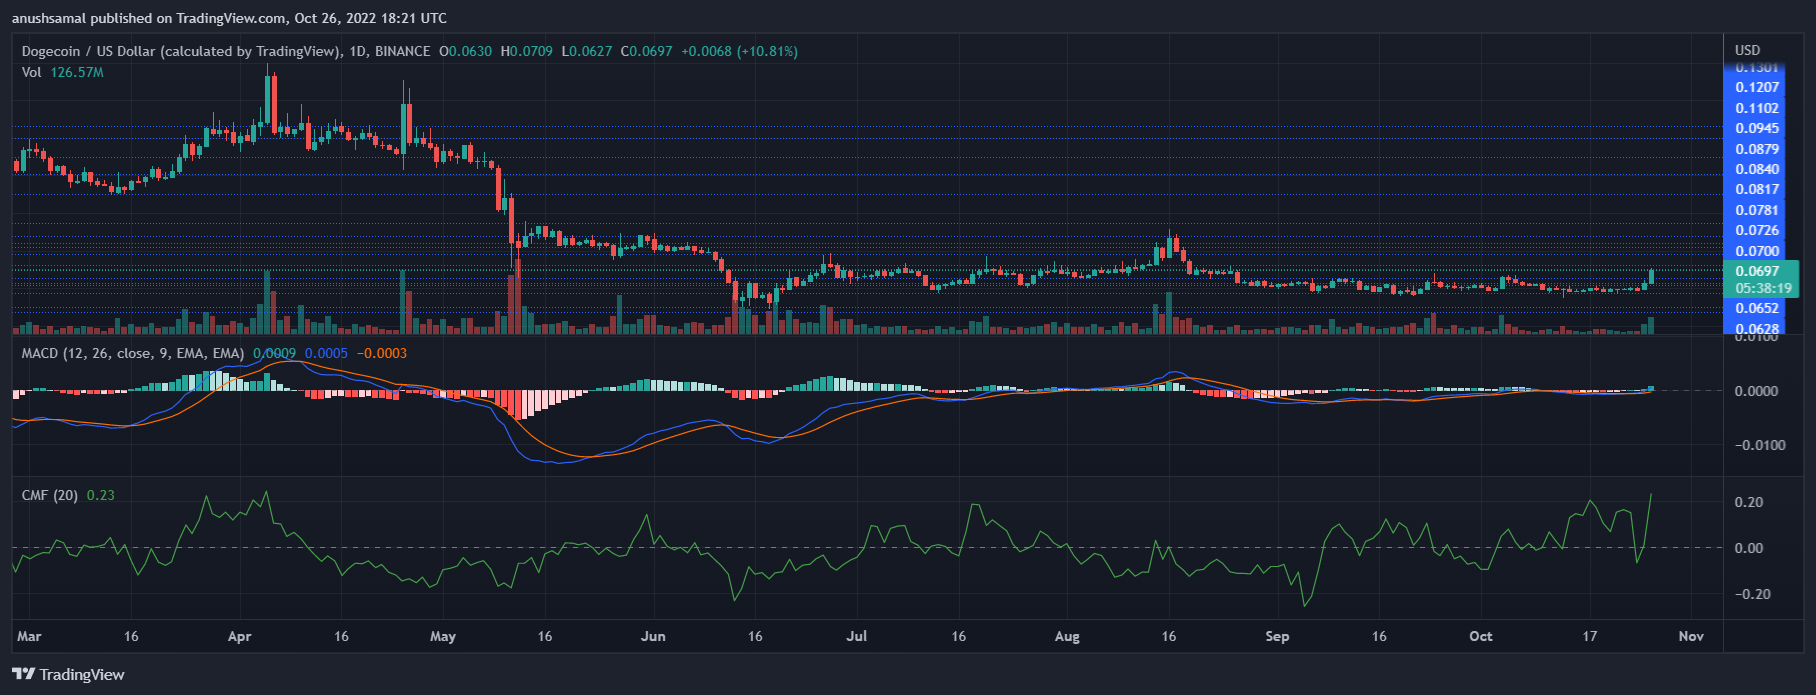
Other technical indicators have also indicated that bullish action was driving Dogecoin. The Moving Average Convergence Divergence indicates the overall price momentum and direction of the coin.
MACD underwent a bullish crossover and portrayed green histograms, which act as buy signal for the coin.
The Chaikin Money Flow is in charge of displaying the asset’s capital inflows and outflows. The CMF was quite positive as the indicator was far up and away from the half-line, signifying positive price movement.
Featured Image From The Hindu, Charts From TradingView
You can get bonuses upto $100 FREE BONUS when you:
💰 Install these recommended apps:
💲 SocialGood - 100% Crypto Back on Everyday Shopping
💲 xPortal - The DeFi For The Next Billion
💲 CryptoTab Browser - Lightweight, fast, and ready to mine!
💰 Register on these recommended exchanges:
🟡 Binance🟡 Bitfinex🟡 Bitmart🟡 Bittrex🟡 Bitget
🟡 CoinEx🟡 Crypto.com🟡 Gate.io🟡 Huobi🟡 Kucoin.


Comments