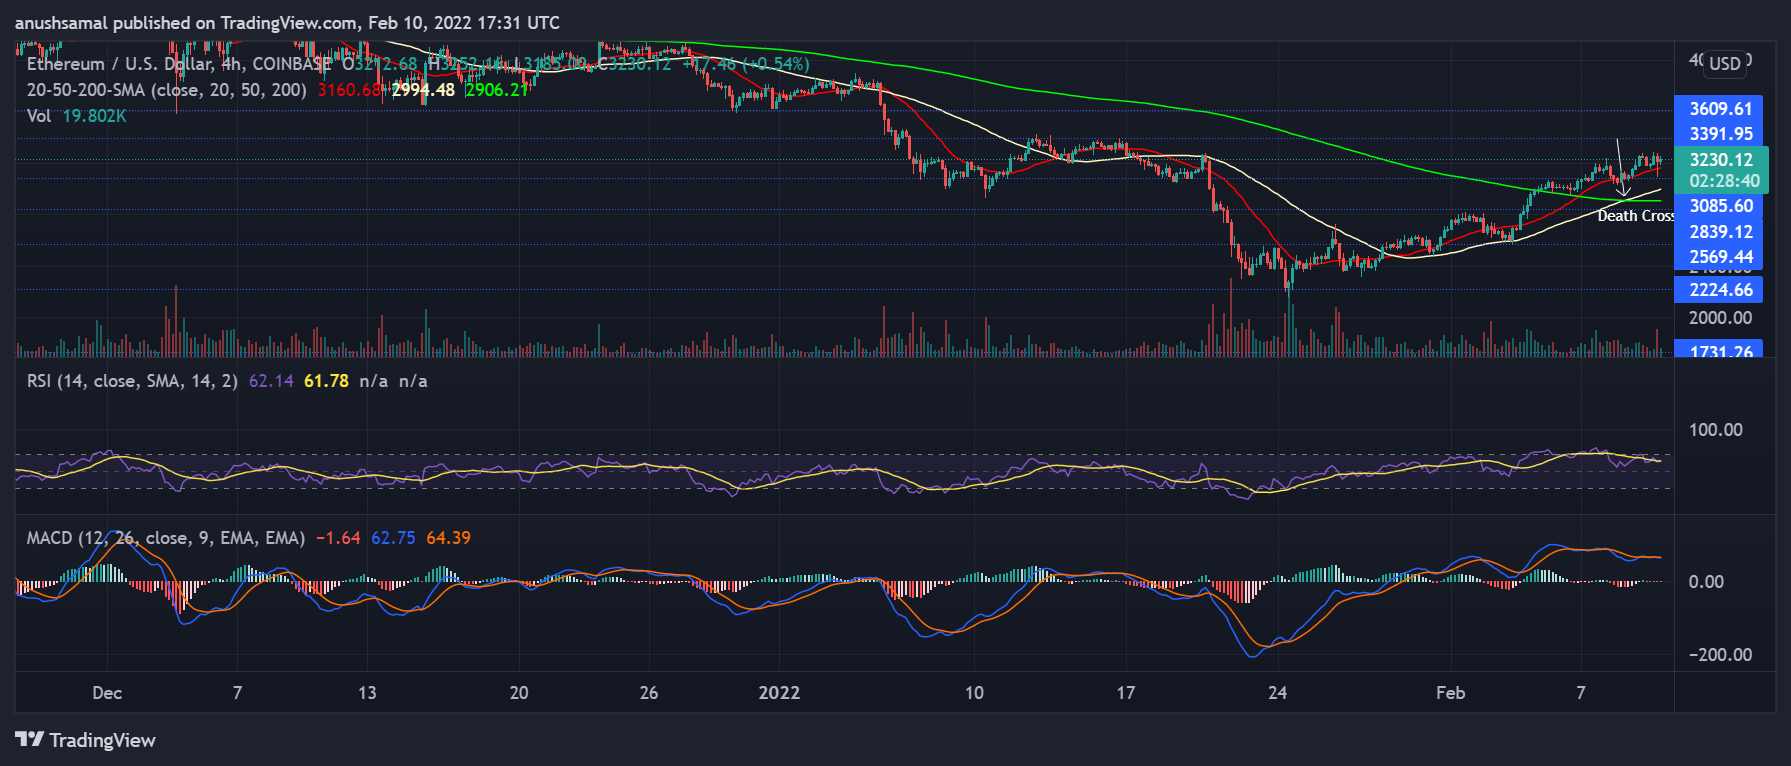
Ethereum has been zooming up on its charts over the past few days. In the last seven days, the altcoin posted double-digit gains as it secured a 20% increase in market value. Post the dip, Ethereum along with other major coins have followed similar kinds of price movement. At the time of writing, ETH was valued at $3230.12.
Price action was considerably bullish today after weeks of consolidation as displayed by Ethereum. The altcoin toppled over its support level of $3085.60 and was seen hovering around the $3200 price level. Indicators pointed towards a bullish price action with possibilities of ETH moving further on the upside to test its immediate resistance levels.
Ethereum Soars By 20% In The Last Week
With Bitcoin recovering on its charts, the broader market displayed strength. Major altcoins have also witnessed increased buying strength. In the case of Ethereum, buyers have flocked the market and have also occasionally pushed ETH to an overvalued and overbought territory.
Ethereum has breached resistance levels one after the other which has shot up investors’ interest and confidence in the past week. Sustained buying strength could make ETH eye its immediate price ceiling of $3400. ETH has managed to surge 50% since January’s price dip.
Price Analysis: ETH/USD Four-Hour Chart

On the four-hour chart, ETH had displayed an upward price action over the past week. At press time, the most popular altcoin was priced at $3230.12. In the past 24 hours, however, Ethereum just appreciated by 1%. Overhead resistance for the coin stood at $3391, past which, the price ceiling awaited at $3609.
The technical outlook for the coin was bullish at the press time, even though over the last day ETH hasn’t managed to secure substantial gains. The price of ETH was seen above the 20-SMA line, a reading that indicated buyers in the market were in charge of pushing the price momentum forward.
The Relative Strength Index has managed to remain above the half-line in the past week, as RSI has dipped below the zero-line. At the time of writing, was near the 60 mark which meant that buyers preceded sellers in the market.
In the case of buyers remaining in the market, if ETH continues to trade above the current mark for the immediate trading sessions there’s a chance that the altcoin will continue to remain bullish. In the event of sellers taking over, the local support level for ETH was at $3085 and then at $2839.
Related article | Bitcoin Steadies Above $45k, US Inflation Comes In At 7.5% Year Over Year
Chances Of ETH Dipping?
Ethereum’s important technical indicators have pointed towards a bullish bias, although some indicators have displayed chances of a price reversal. On the four-hour chart, ETH had formed a Death Cross which is considered bearish. The 200-SMA line crossed over the short-term 50-SMA line, ever since which, ETH continued to hover near the current price level.
MACD flashed a bearish crossover, with red histograms lining up underneath the zero-line. This meant that bears could be taking over and a possible sell signal. In accordance with the sell-signal RSI despite being positive noted a downward movement at the time of writing.
The volume of Ethereum closed high in red the previous session which displayed that bears dominated the previous price session. In case Ethereum laterally trades over the next trading sessions, it could dip to its aforementioned support levels.
Related Reading | XLM Takes Off With 20% Gain, SDF CEO Outlines Drivers Which Could Fuel Rally
Tags: ethereumprice analysis

You can get bonuses upto $100 FREE BONUS when you:
💰 Install these recommended apps:
💲 SocialGood - 100% Crypto Back on Everyday Shopping
💲 xPortal - The DeFi For The Next Billion
💲 CryptoTab Browser - Lightweight, fast, and ready to mine!
💰 Register on these recommended exchanges:
🟡 Binance🟡 Bitfinex🟡 Bitmart🟡 Bittrex🟡 Bitget
🟡 CoinEx🟡 Crypto.com🟡 Gate.io🟡 Huobi🟡 Kucoin.


Comments