The United States equities markets have given back some of the gains made last week and that has pulled Bitcoin to the psychological support at $20,000. This suggests that investors are nervous to buy risky assets at higher levels.
Meanwhile, while speaking to the hosts of the Bankless podcast on June 23, Mark Cuban said that the crypto bear market could end after the price gets so cheap that investors go and start buying or an application with utility is launched that attracts users.

Several analysts expect Bitcoin to continue falling and eventually bottom out between $10,000 and $12,000. However, John Bollinger, the creator of the popular Bollinger Bands trading indicator, said that the monthly charts suggest that Bitcoin’s price has reached “a logical place to put in a bottom.”
Could bears maintain the selling pressure and pull cryptocurrency prices lower? Let’s study the charts of the top 10 cryptocurrencies to find out.
BTC/USDT
Bitcoin turned down from $22,000 on June 26 and has gradually slipped to the immediate support at $19,637. This suggests that the bears remain in command and every rally is being sold into.

If the price breaks below $19,637, the BTC/USDT pair could be at risk of dropping to the crucial support at $17,622. This is an important level to watch out for because a break and close below it could start the next leg of the downtrend. The pair could then decline to $15,000.
On the other hand, if the price rebounds off $19,637, it will suggest demand at lower levels. The buyers will then try to push the price above the 20-day exponential moving average (EMA) ($22,393). If they succeed, the pair could rally to the 50-day simple moving average (SMA) ($26,735).
ETH/USDT
Ether (ETH) turned down from the 20-day EMA ($1,268) on June 26, suggesting that the sentiment remains negative and traders are selling on rallies.

The downsloping moving averages and the RSI in the negative zone indicate that bears are in control. The sellers will attempt to pull the price below the immediate support at $1,050. If they succeed, the ETH/USDT pair could plunge to the June 18 intraday low of $881.
A break below this support could signal the resumption of the downtrend. The next support on the downside is at $681.
Contrary to this assumption, if the price rebounds off $1,050, it will suggest demand at lower levels. The buyers will then make another attempt to push the price above the 20-day EMA and start the journey toward $1,500 and later $1,700.
BNB/USDT
The buyers failed to push and sustain BNB above the 20-day EMA ($238) between June 24 to 28. This resulted in profit-booking, which has pulled the price to the strong support of $211.

The 20-day EMA has started to turn down once again and the RSI has dipped into the negative territory. This suggests that bears have the upper hand. If the price slides below $211, the BNB/USDT pair could drop to the critical support of $183. If this support collapses, the pair could resume its downtrend and plummet toward $150.
Conversely, if the price rebounds off $211, it will suggest that bulls are attempting to form a higher low. A strong bounce could increase the prospects of a break above $250. The pair could then rally to the 50-day SMA ($273).
XRP/USDT
Ripple (XRP) slipped below the breakout level of $0.35 on June 28, which suggests that bears continue to sell aggressively at higher levels.

The 20-day EMA ($0.35) is flattish but the RSI has dropped below 40, suggesting that the bears have a slight edge. The sellers will attempt to pull the price to the vital support at $0.28. This is an important level to keep an eye on because if it gives way, the XRP/USDT pair could start the next leg of the downtrend.
On the contrary, if the price turns up from the current level or $0.28, it will suggest that bulls are buying at lower levels. That could keep the pair range-bound between $0.28 and the 50-day SMA ($0.38) for a few days.
ADA/USDT
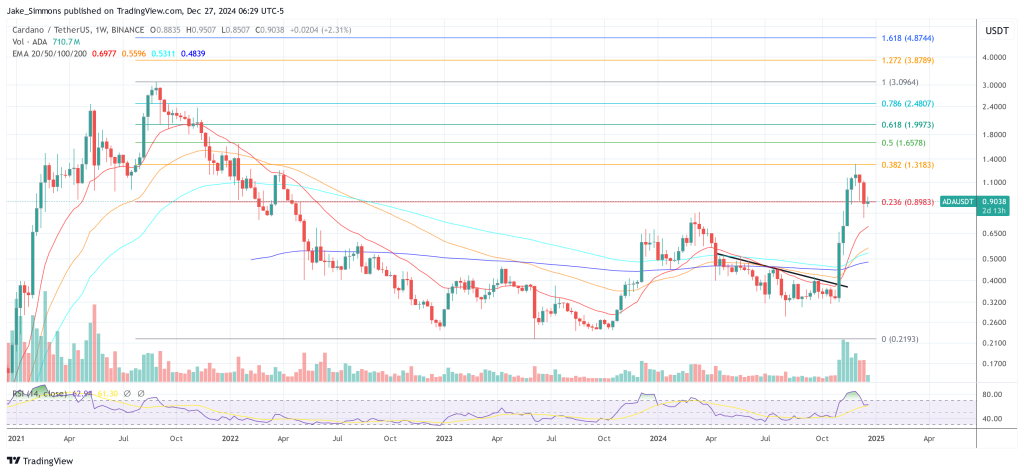
The bears thwarted repeated attempts by the bulls to push Cardano (ADA) above the 20-day EMA ($0.50) in the past few days. This suggests that the bears are defending the level aggressively.

The price could drop to the strong support zone at $0.44 to $0.40. If the price rebounds off this zone with strength, it will suggest that bulls are accumulating on dips. The buyers will then again try to propel the price above the moving averages. If they can pull it off, the ADA/USDT pair could start an up-move toward $0.70.
This positive view could invalidate in the short term if bears sink the pair below the support zone. If that happens, the pair could indicate the resumption of the downtrend. The next support is at $0.33.
SOL/USDT
The tight range trading in Solana (SOL) resolved to the downside with a break below the 20-day EMA ($37). The bears are attempting to pull the price below the immediate support at $33.

If they succeed, the SOL/USDT pair could decline to $27 and then retest the June 14 intraday low of $25.86.
Contrary to this assumption, if the price rebounds off $33, it will suggest that the bulls are attempting to form a higher low. The buyers will then try to clear the overhead hurdle at $43. If that happens, the pair could signal a potential change in trend. The pair may then rise to $60 where the bears may again mount a strong defense.
DOGE/USDT
Dogecoin (DOGE) turned down from the 50-day SMA ($0.08) on June 27 and broke below the 20-day EMA ($0.07) on June 28. This suggests that bears have not given up and they continue to sell on rallies.

The bears will try to sink the price to $0.06. If this level cracks, the next stop could be a retest of the critical level at $0.05.
Alternatively, if the price turns up from the current level or the support at $0.06 and rises back above the 20-day EMA, it will suggest that bulls are attempting to form a higher low. The bullish momentum could pick up on a break above $0.08. The DOGE/USDT pair could then attempt a rally to the psychological level of $0.10.
Related: Double bubble? Terra's defunct 'unstablecoin' suddenly climbs 800% in one week
DOT/USDT
Repeated failures to push and sustain the price above the 20-day EMA ($7.93) may have tempted short-term traders to book profits in Polkadot (DOT). The price turned down from the 20-day EMA and slipped to $7.30 on June 28.

Both the bulls and the bears are battling it out for supremacy near the $7.30 level. If the bears come out on top, the DOT/USDT pair could drop to the crucial level of $6.36. The bulls are expected to defend this level aggressively because a break below it could signal the resumption of the downtrend.
Conversely, if the price rebounds off the current level, the buyers will again try to achieve a close above the 20-day EMA. If they manage to do that, the pair could rise to the 50-day SMA ($8.97).
SHIB/USDT
Shiba Inu (SHIB) slipped back below the 50-day SMA ($0.000011) on June 28, suggesting that the bears are active at higher levels. Although the price dipped below $0.000010, the bears have not been able to build upon this advantage.

This suggests that selling dries up at lower levels. The bulls will again try to push the price above the 50-day SMA and challenge the resistance at $0.000012. A break and close above this level could open the doors for a possible rally to $0.000014.
The 20-day EMA ($0.000010) has flattened out and the RSI is just below the midpoint, indicating a balance between supply and demand. If the price slips below $0.000009, the advantage could tilt in favor of the sellers. The pair may then drop to $0.000007.
LEO/USD
UNUS SED LEO (LEO) broke and closed above the resistance line of the descending channel on June 25 but the bulls could not push the price above $6. That may have attracted profit-booking from short-term traders, which pulled the price back into the channel on June 27.

The 20-day EMA ($5.57) is sloping up and the RSI is in the positive territory, suggesting that bulls have the upper hand. The buyers are again attempting to clear the overhead hurdle at $6. If they succeed, the LEO/USD pair could rally to $6.50 and then to the pattern target at $6.90.
Contrary to this assumption, if the price once again turns down from $6, it will suggest that bears are defending this level with vigor. The sellers will then attempt to sink the price below the 20-day EMA and challenge the 50-day SMA ($5.24).
The views and opinions expressed here are solely those of the author and do not necessarily reflect the views of Cointelegraph. Every investment and trading move involves risk. You should conduct your own research when making a decision.
Market data is provided by HitBTC exchange.

You can get bonuses upto $100 FREE BONUS when you:
💰 Install these recommended apps:
💲 SocialGood - 100% Crypto Back on Everyday Shopping
💲 xPortal - The DeFi For The Next Billion
💲 CryptoTab Browser - Lightweight, fast, and ready to mine!
💰 Register on these recommended exchanges:
🟡 Binance🟡 Bitfinex🟡 Bitmart🟡 Bittrex🟡 Bitget
🟡 CoinEx🟡 Crypto.com🟡 Gate.io🟡 Huobi🟡 Kucoin.


Comments