Bitcoin price failed to stay above the $35,000 support against the US Dollar. BTC is declining and it is likely to extend losses below $33,000 in the short-term.
- Bitcoin started a fresh decline after it broke the $36,500 and $36,000 support levels.
- The price is currently well below $36,000 and the 100 hourly simple moving average.
- There was a break below a major ascending channel with support near $35,600 on the hourly chart of the BTC/USD pair (data feed from Kraken).
- The pair is likely to continue lower below the $33,000 and $32,000 support levels.
Bitcoin Price is Down Over 5%
Bitcoin failed to stay above the $36,500 support zone and extended its decline. BTC broke the $35,500 support level and settled below the 100 hourly simple moving average.
There was a clear break below a major ascending channel with support near $35,600 on the hourly chart of the BTC/USD pair. The pair gained pace below the $35,00 support level and it even broke $34,200. There was a spike below the $34,000 level and the price is currently struggling to recover.
An immediate resistance is near the $34,150 level. It is near the 23.6% Fib retracement level of the recent drop from the $36,824 high to $33.350 low.
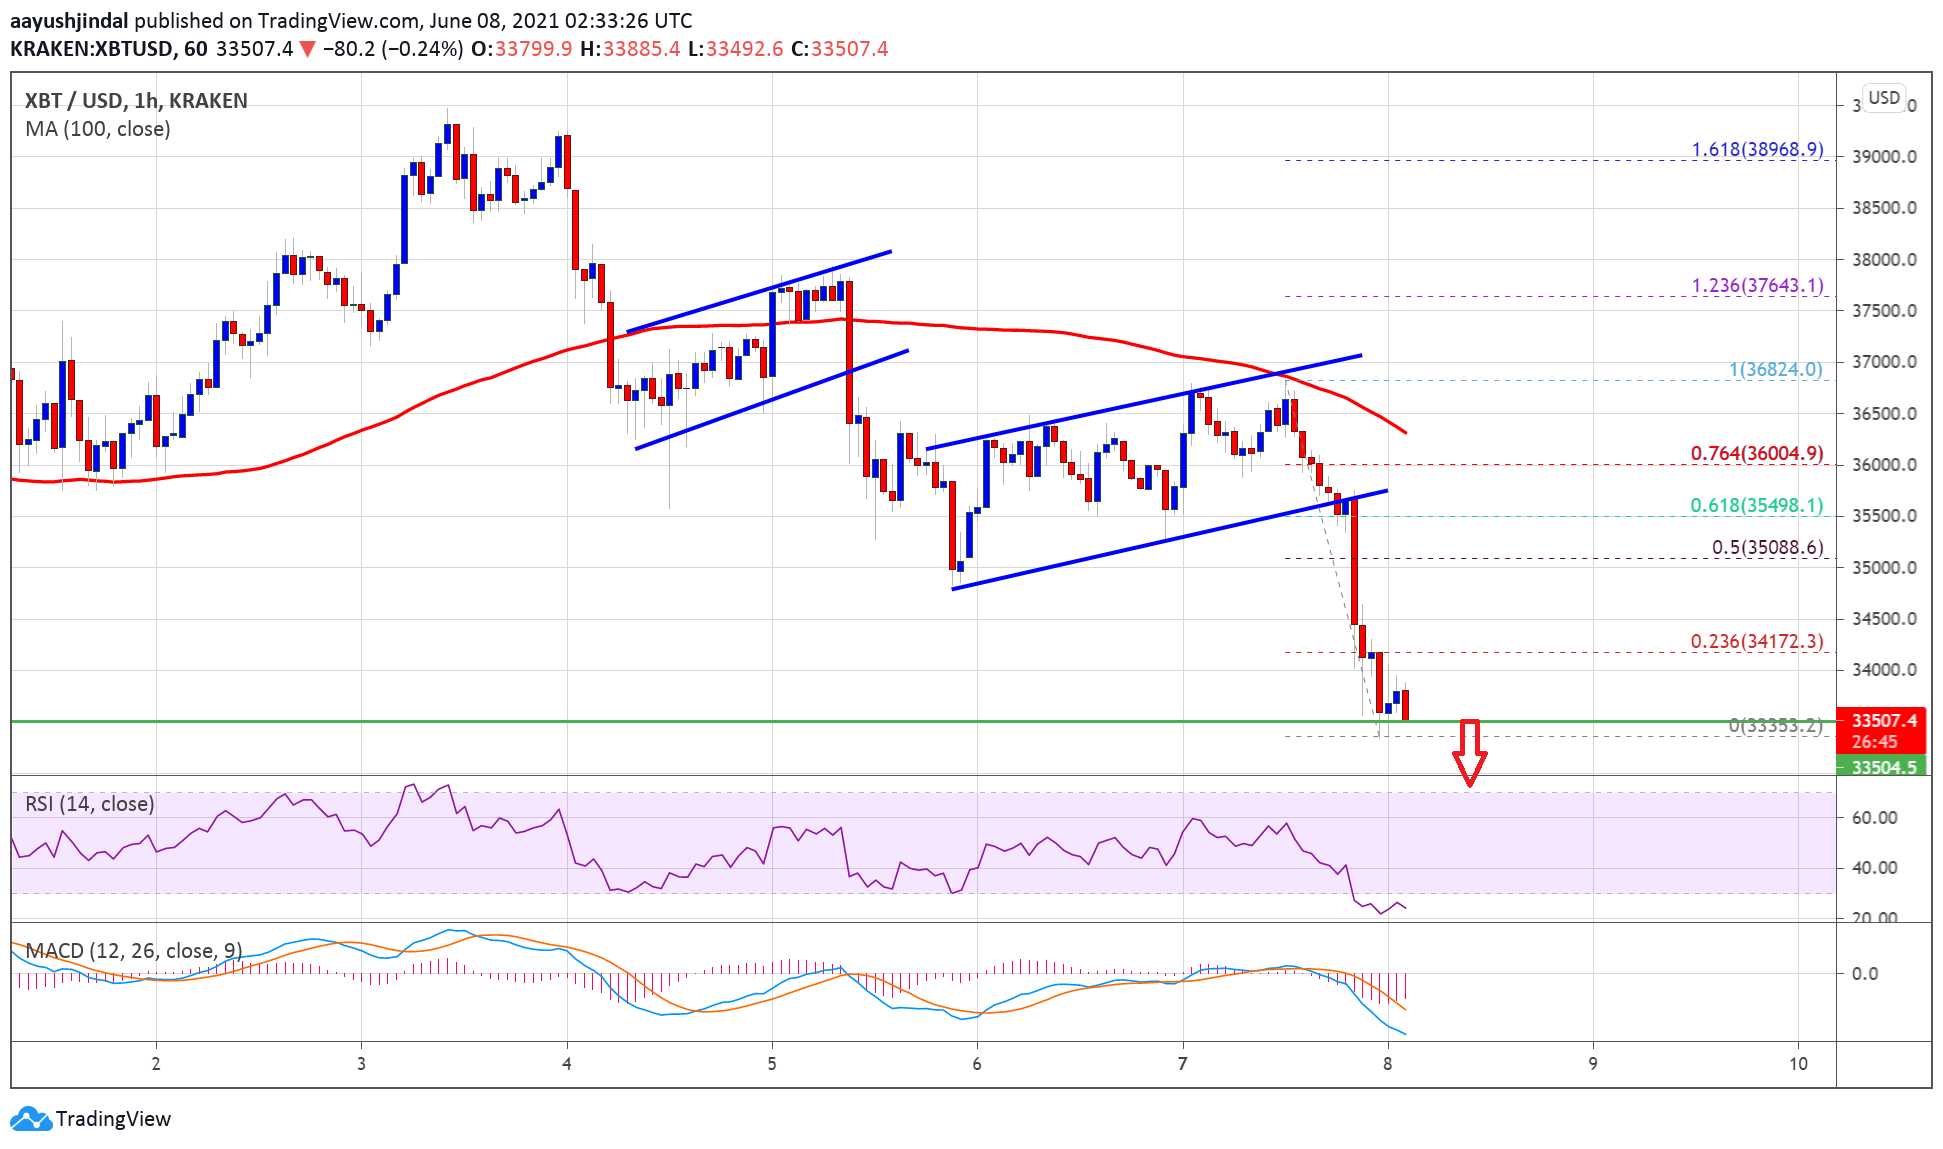
Source: BTCUSD on TradingView.com
The first major resistance is near the $35,000 level. The 50% Fib retracement level of the recent drop from the $36,824 high to $33.350 low is also near $35,100. The main resistance is near the $36,000 zone and the 100 hourly simple moving average. A clear break above the $36,000 level could reverse the current bearish bias.
More Losses in BTC?
If bitcoin fails to clear the $35,000 resistance, it could continue to move down. An initial support on the downside is near the $33,200 level.
The first major support is near the $32,500 level. The main support is near the $32,000 level. If the bulls fail to protect the $32,000 support zone, there is a risk of a sharp decline. In the stated case, the price could even struggle to stay above the key $30,000 support zone.
Technical indicators:
Hourly MACD &- The MACD is now gaining pace in the bearish zone.
Hourly RSI (Relative Strength Index) &- The RSI for BTC/USD is now well below the 50 level.
Major Support Levels &- $33,200, followed by $32,000.
Major Resistance Levels &- $34,150, $35,000 and $36,000.

You can get bonuses upto $100 FREE BONUS when you:
💰 Install these recommended apps:
💲 SocialGood - 100% Crypto Back on Everyday Shopping
💲 xPortal - The DeFi For The Next Billion
💲 CryptoTab Browser - Lightweight, fast, and ready to mine!
💰 Register on these recommended exchanges:
🟡 Binance🟡 Bitfinex🟡 Bitmart🟡 Bittrex🟡 Bitget
🟡 CoinEx🟡 Crypto.com🟡 Gate.io🟡 Huobi🟡 Kucoin.


Comments