Bitcoin price corrected lower from the $38,000 resistance zone against the US Dollar. BTC is holding the 100 hourly SMA and it could start a fresh increase in the near term.
- Bitcoin is holding a couple of important supports near the $36,000 zone.
- The price is currently trading nicely above $36,000 and the 100 hourly simple moving average.
- There is a key declining channel forming with resistance near $36,800 on the hourly chart of the BTC/USD pair (data feed from Kraken).
- The pair could start a major increase if it breaks the $37,000 resistance zone.
Bitcoin Price Remains Supported
Bitcoin gained pace above the $35,500 resistance and extended its upward move. BTC even broke the $37,000 resistance level and the 100 hourly simple moving average.
However, the bulls struggled to clear the $38,000 resistance zone. A high was formed near $37,900 and the price recently corrected lower. There was a break below the $37,000 support level. Bitcoin declined below the 23.6% Fib retracement level of the recent upward move from the $34,225 swing low to $37,900 high.
The price is now trading nicely above $36,000 and the 100 hourly simple moving average. There is also a key declining channel forming with resistance near $36,800 on the hourly chart of the BTC/USD pair.
The pair is also finding bids near the 50% Fib retracement level of the recent upward move from the $34,225 swing low to $37,900 high.
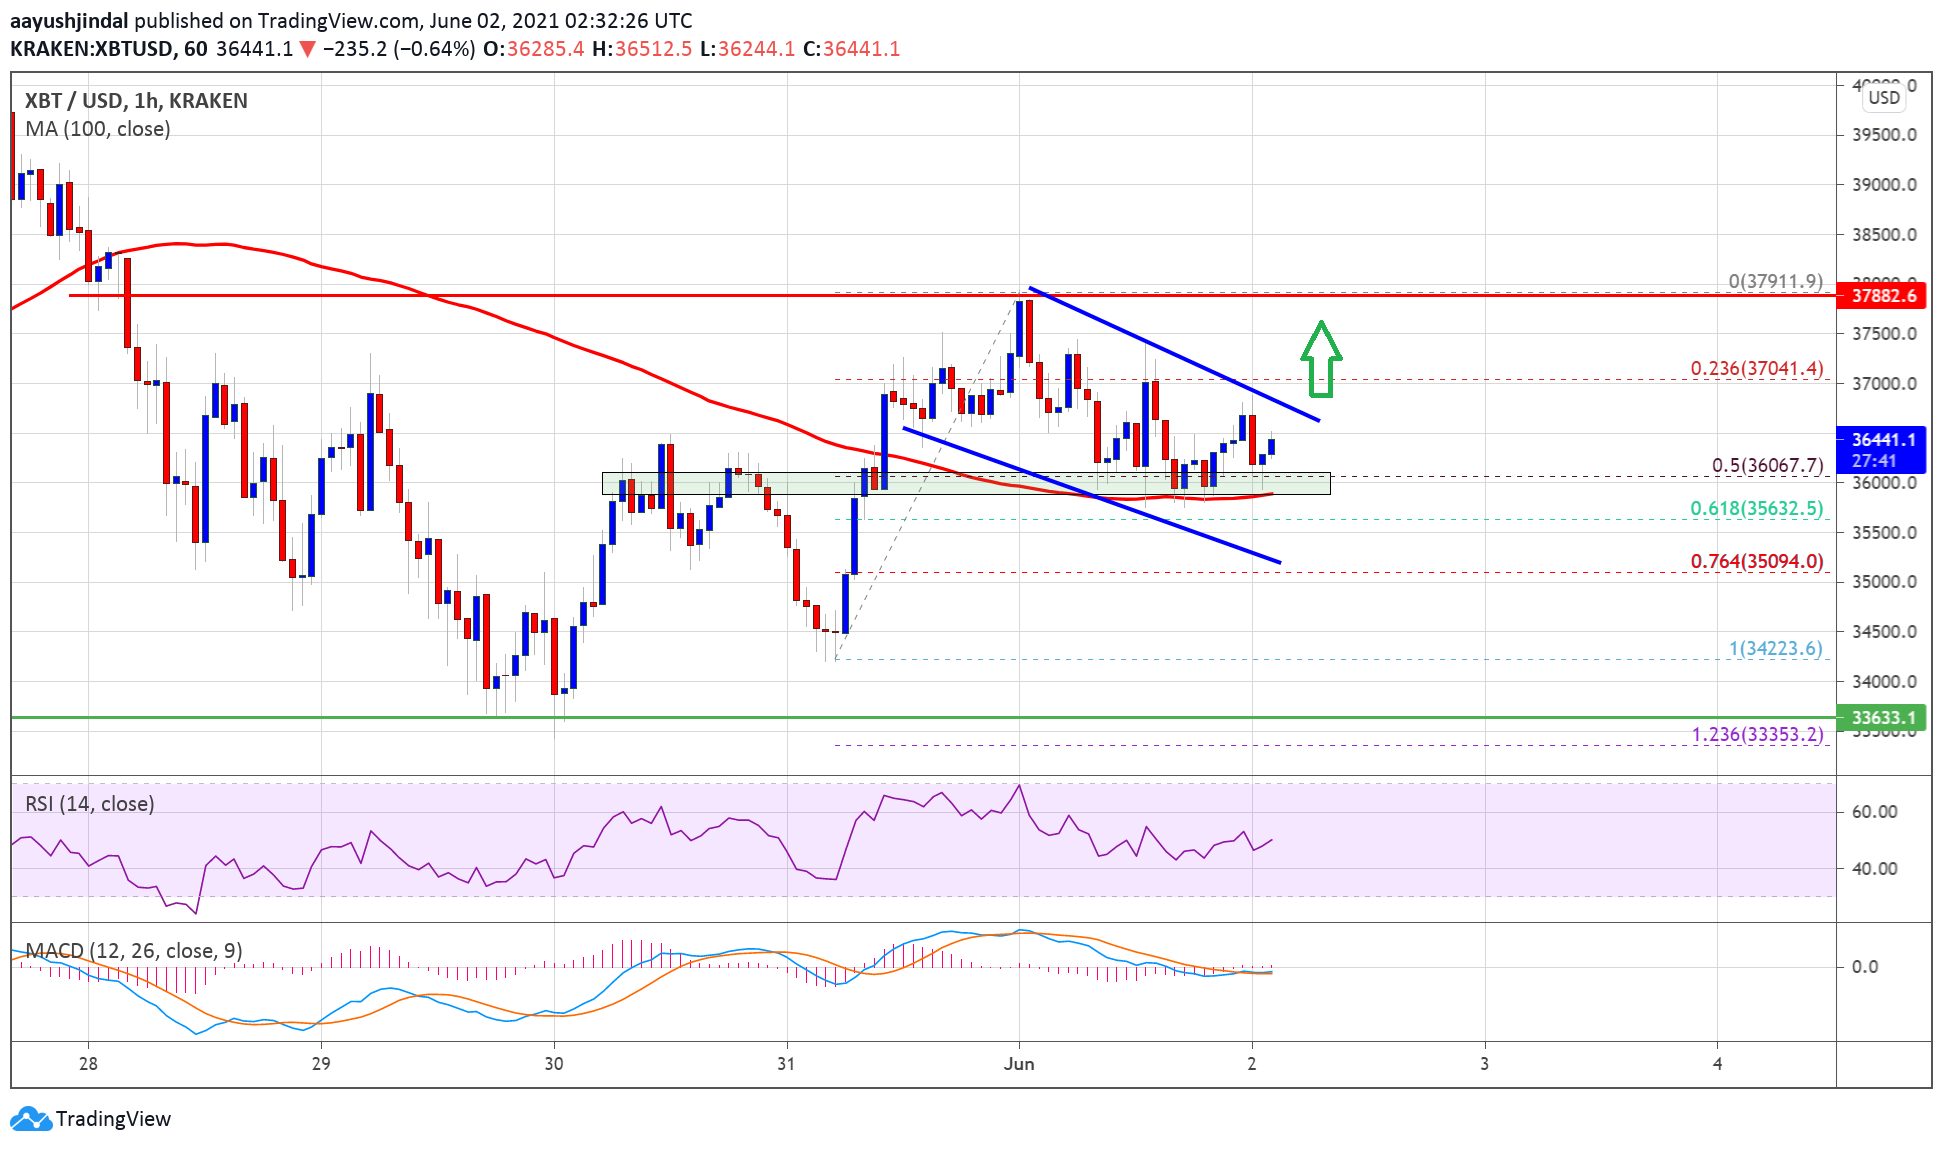
Source: BTCUSD on TradingView.com
On the upside, an immediate resistance is near the $36,800 level. The first major resistance is near the $37,000 level. A clear break above the $37,000 zone could set the pace for a fresh high above $37,900. The next major resistance is near the $38,800 level, above which the price could test the $40,000 zone.
Downside Break in BTC?
If bitcoin fails to clear the $37,000 resistance, it could correct lower. An initial support on the downside is near the $36,200 level.
The first major support is near the $36,000 level and the 100 hourly simple moving average. If there is a downside break below the $36,000 support, the price could start another decline. In the stated case, the price is likely to dive towards the $35,000 support.
Technical indicators:
Hourly MACD &- The MACD is slowly gaining pace in the bullish zone.
Hourly RSI (Relative Strength Index) &- The RSI for BTC/USD is just above the 50 level.
Major Support Levels &- $36,000, followed by $35,500.
Major Resistance Levels &- $37,000, $38,000 and $40,000.

You can get bonuses upto $100 FREE BONUS when you:
💰 Install these recommended apps:
💲 SocialGood - 100% Crypto Back on Everyday Shopping
💲 xPortal - The DeFi For The Next Billion
💲 CryptoTab Browser - Lightweight, fast, and ready to mine!
💰 Register on these recommended exchanges:
🟡 Binance🟡 Bitfinex🟡 Bitmart🟡 Bittrex🟡 Bitget
🟡 CoinEx🟡 Crypto.com🟡 Gate.io🟡 Huobi🟡 Kucoin.


Comments