Ethereum is trading in a positive zone above the $2,400 support zone the 100 hourly SMA against the US Dollar. ETH price is likely to rally if there is a clear break above $2,500.
- Ethereum is trading in a positive zone above the $2,400 and $2,420 support levels.
- The price is now trading above $2,450 and the 100 hourly simple moving average.
- There was a break above a major bearish trend line with resistance near $2,400 on the hourly chart of ETH/USD (data feed via Kraken).
- The pair could correct lower, but the price is likely to remain well bid above $2,400.
Ethereum Price Is Showing Positive Signs
After forming a base above $2,350, ethereum started a steady increase. ETH broke the $2,400 resistance zone and it settled nicely above the 100 hourly simple moving average.
However, ether struggled to gain pace similar to bitcoin. It climbed above the $2,450 and $2,500 resistance. There was also a break above a major bearish trend line with resistance near $2,400 on the hourly chart of ETH/USD.
The pair tested the $2,550 resistance and it is now correcting gains. It traded below the 23.6% Fib retracement level of the upward move from the $2,311 swing low to $2,554 high. Ether is now trading above $2,450 and the 100 hourly simple moving average.
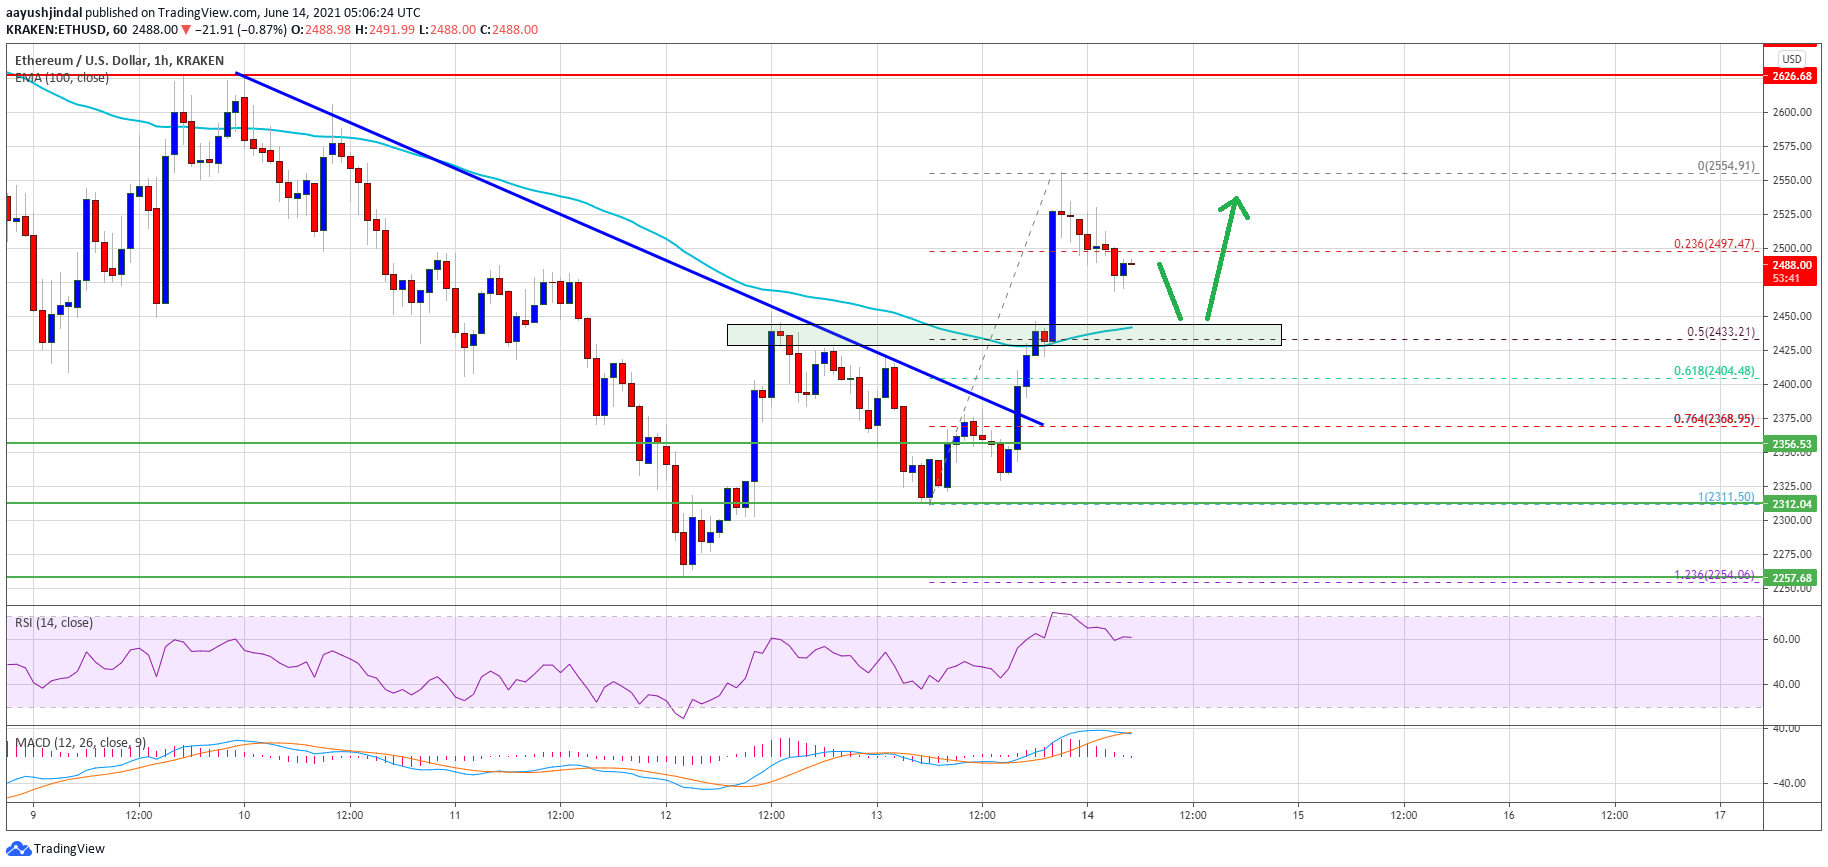
Source: ETHUSD on TradingView.com
The first major support on the downside is near the $2,440 level. It is near the 50% Fib retracement level of the upward move from the $2,311 swing low to $2,554 high. On the upside, the price is facing resistance near the $2,520 level.
The main breakout resistance is now forming near the $2,550 level. A close above the $2,550 level could start a major increase towards the $2,680 level or even $2,750 in the near term.
Dips Supported in ETH?
If Ethereum fails to clear the $2,520 and $2,550 resistance levels, it could start a downside correction. An initial support on the downside is near the $2,450 level.
The main support is now forming near the $2,440 level and the 100 hourly SMA. A downside break below $2,450 may possibly put a lot of pressure on the bulls. The next key support is near the $2,400 level.
Technical Indicators
Hourly MACD &- The MACD for ETH/USD is slowly losing pace in the bullish zone.
Hourly RSI &- The RSI for ETH/USD is currently above the 50 level.
Major Support Level &- $2,440
Major Resistance Level &- $2,550

You can get bonuses upto $100 FREE BONUS when you:
💰 Install these recommended apps:
💲 SocialGood - 100% Crypto Back on Everyday Shopping
💲 xPortal - The DeFi For The Next Billion
💲 CryptoTab Browser - Lightweight, fast, and ready to mine!
💰 Register on these recommended exchanges:
🟡 Binance🟡 Bitfinex🟡 Bitmart🟡 Bittrex🟡 Bitget
🟡 CoinEx🟡 Crypto.com🟡 Gate.io🟡 Huobi🟡 Kucoin.


Comments