Bitcoin has held critical support after a move to the downside on Friday and trades at $37,539. A good old weekend pump has brought it back from the mid-zone of the $30,000 range and now it might make a push towards $38,000.

In the short term, reclaiming the $40,000 area seems like the most bullish scenario, but if the price action has had something in common during these past weeks, it’s the lack of volume.
Kevin Kelly, Co-founder and Head of Global Macroeconomics at Delphi Digital published a report on the potential scenarios for Bitcoin. The analyst said that leveraged positions signaled a major correction was due.
Conversely, BTC’s price has been forming a “major head and shoulders pattern”. Thus, the analyst believes it’s possible for the cryptocurrency to trend downwards and dive back towards the critical support at $30,000.
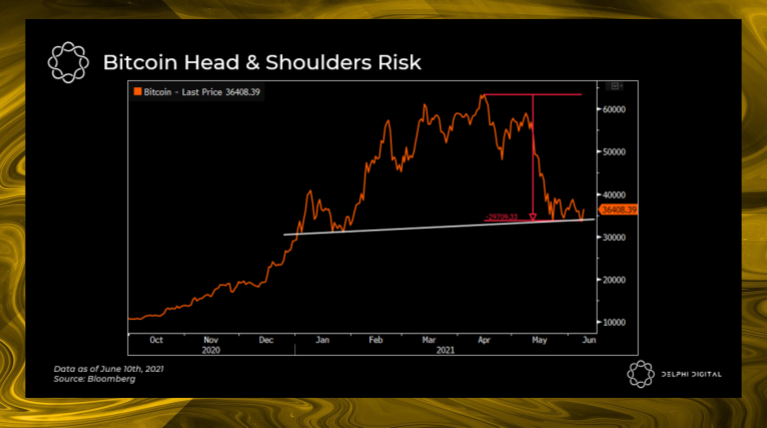
If Bitcoin’s price trends below $30,000, a revisit of the $20,000 it’s possible by the “traditional rule of thumb”. Kelly added:
However, technical analysis is only one piece of the bigger puzzle, especially when it comes to $BTC. Having said that, an extended move below $30k could spell more short-term pain for hodlers; this price level also coincides with BTC’s 50-week moving average.
A 50% dropped, as long-term BTC traders know, it’s not indicative of a guaranteed recovery. On the contrary, BTC’s price has seen 80% corrections on its way to new highs.
There have been multiple instances where BTC rebounded after a +40% sell-off only to find its recovery to be short-lived. One somewhat recent example is Dec. ’19.
What Are The Ingredients For A Bitcoin Bull Run?
In addition, Kelly said that 85% of BTC addresses are in profit. In the past, price bottoms see a reduction in the number of UTXOs in profit to around 50% or less. This suggests more downside in the short term.
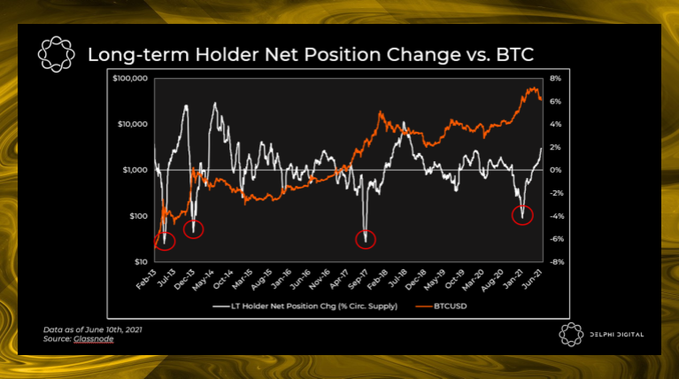
In defense of the bulls, long-term holders have changed their position and begun accumulated after a period of realizing profits. However, as the analyst said, this metric rarely suggests an immediate change in the price action to the upside.
Looking at the total supply of BTC held by long-term holders on a percentage basis, we can see the trend has started to reverse. Total BTC supply held by LT holders recently bottomed at 58.5% but is now back above 61%. Again, this is a good sign longer term.
A major headwind for Bitcoin, in the short term, is the “deceleration” of central bank asset purchases. In previous cycles, BTC’s price peaks at the same time as Year-on-Year (YoY) growth in central bank balance sheets, Kelly said.
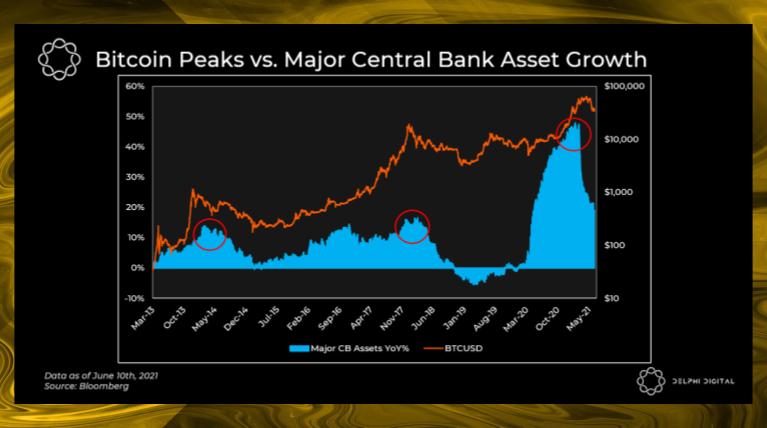
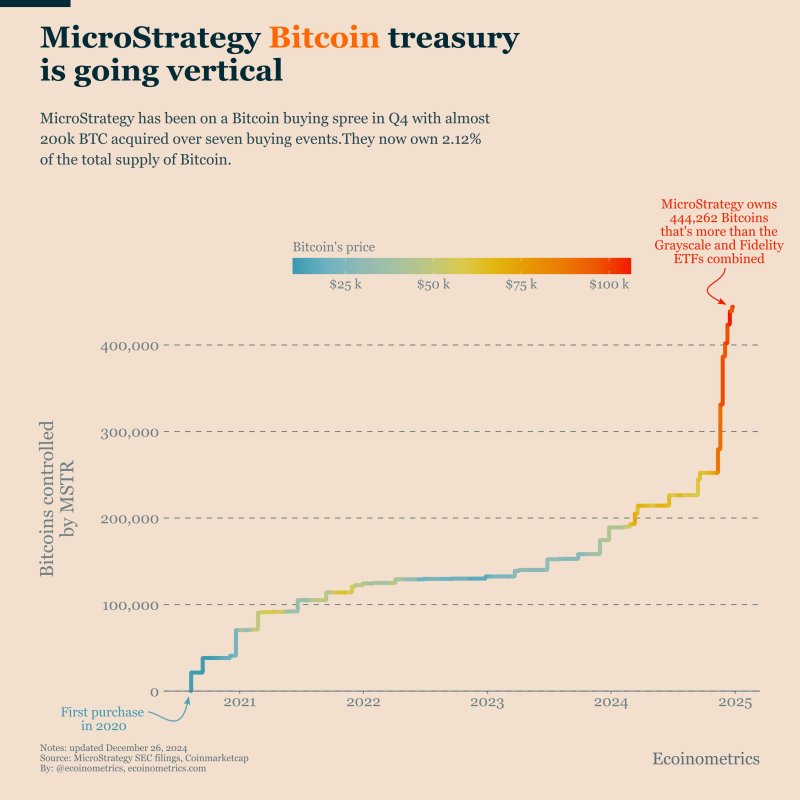
The analyst believes Bitcoin needs another catalyst, a big company adding to its balance sheet, for example, for it to retake bullish momentum. However, he believes that in the long term the trend remains positive for holders. Kelly concluded:
(…) despite its recent drawdown, the long-term chart clearly shows BTC still in an uptrend. If $BTC were to retest prior support of $20k then we’d start to get much more concerned.

You can get bonuses upto $100 FREE BONUS when you:
💰 Install these recommended apps:
💲 SocialGood - 100% Crypto Back on Everyday Shopping
💲 xPortal - The DeFi For The Next Billion
💲 CryptoTab Browser - Lightweight, fast, and ready to mine!
💰 Register on these recommended exchanges:
🟡 Binance🟡 Bitfinex🟡 Bitmart🟡 Bittrex🟡 Bitget
🟡 CoinEx🟡 Crypto.com🟡 Gate.io🟡 Huobi🟡 Kucoin.






Comments