Data shows the weekly volatility of Bitcoin has plunged recently, something that has historically led to a violent decompression for the asset.
Bitcoin 1-Week Realized Volatility Has Hit A Low Level Recently
In a new post on X, CryptoQuant author Axel Adler Jr has discussed about the trend in the Realized Volatility for Bitcoin. The “Realized Volatility” here refers to an indicator that calculates how ‘volatile’ BTC has been using its percentage returns during a specific window of time.
In the context of the current topic, the window is of one week. Thus, this version of the Realized Volatility tells us about the percentage difference between the price high and low during the past week.
Below is the chart for the indicator shared by the analyst, that shows the trend in its value during the last few years.
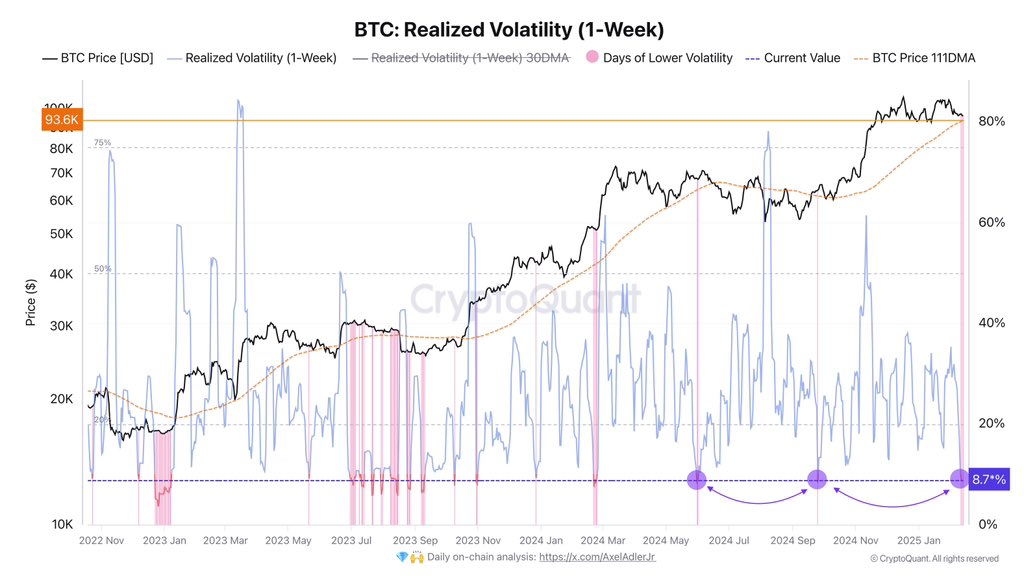
As is visible in the above graph, the Bitcoin 1-week Realized Volatility has recently seen a sharp decline to the 8.7% mark. This is a low level for this cycle, as the metric has only gone below it on a few occasions.
In the chart, the analyst has highlighted all the instances where the indicator touched this line or fell under it. Interestingly, the volatility of the cryptocurrency compressing to this degree has generally led into a violent move for its price.
There is no particular pattern related to whether the move following a low volatility period would be bearish or bullish, though, as BTC has seen both types of trends during the last few years.
The last time that the 1-week Realized Volatility declined to the level, for example, led into a bull rally for Bitcoin. The instance before that, on the other hand, resulted in bearish action for the coin.
Adler Jr has also pointed out that BTC is currently trading near its 111-day moving average (MA), a level that has been important for it over the years. “If conditions do not improve, the next move could be a drop to $92K, below the 111DMA,” notes the analyst.
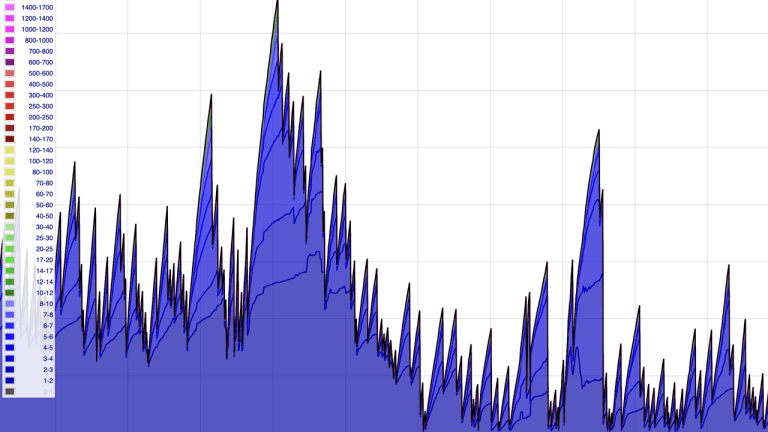
In some other news, the Bitcoin Net Taker Volume, a metric that measures the difference between the taker buy and taker sell volumes of BTC, has dipped into the negative zone recently, as CryptoQuant community analyst Maartunn has explained in an X post.

The indicator’s dip into the red territory means the short volume is outpacing the long one, so a bearish sentiment is shared by the derivatives traders. Interestingly, as the analyst has highlighted in the above graph, this pattern has consistently signaled a local bottom for Bitcoin during the recent phase of consolidation.
BTC Price
At the time of writing, Bitcoin is floating around $97,400, up around 1% in the last 24 hours.

You can get bonuses upto $100 FREE BONUS when you:
💰 Install these recommended apps:
💲 SocialGood - 100% Crypto Back on Everyday Shopping
💲 xPortal - The DeFi For The Next Billion
💲 CryptoTab Browser - Lightweight, fast, and ready to mine!
💰 Register on these recommended exchanges:
🟡 Binance🟡 Bitfinex🟡 Bitmart🟡 Bittrex🟡 Bitget
🟡 CoinEx🟡 Crypto.com🟡 Gate.io🟡 Huobi🟡 Kucoin.


Comments